

Mathematical functions are like magical mathematical machines that help us to connect numbers in a special way. Let’s think of the functions as secret recipes that take a number and then add an interesting touch to it. Within a mathematical function there are combinations of numbers, variables and mathematical operations, such as addition, subtraction, multiplication and division, i.e. algebraic expressions.
Index
What Is a Function?
A function is like a rule that tells us what to do with numbers. In mathematics, we write a function as f(x) or y = f(x) to show that it is related to a number that we call x. We can use another letter to represent this number. If we use the letter m the function would be written as f(m) or if we use the letter p, the function would be written as f(p).
When we put a number in the function, we get another number as a result. Let’s take a look at an example!
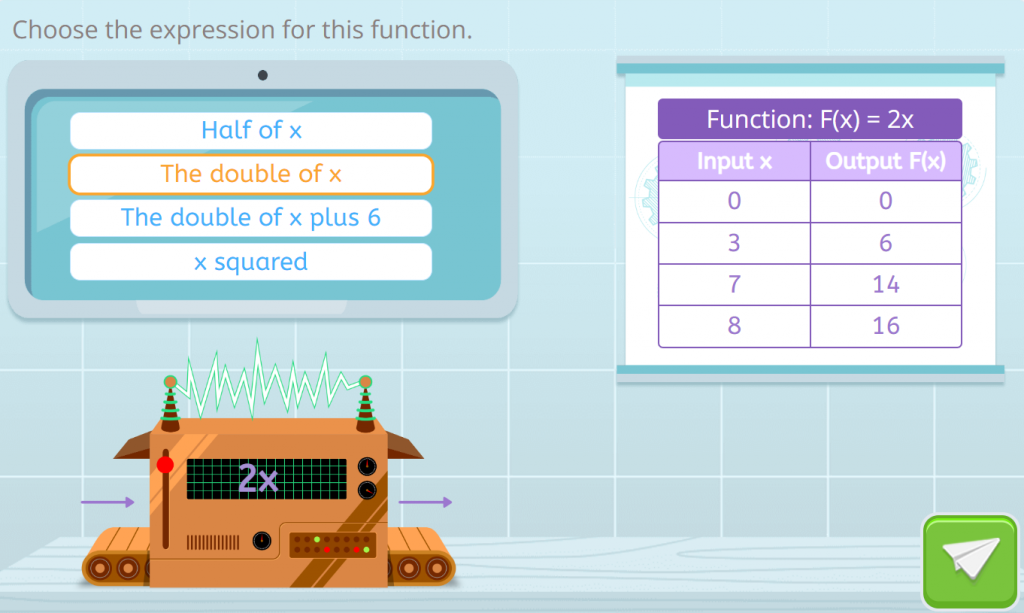
In this Smartick exercise, we have a machine that doubles any number that goes into the machine because it multiplies it by 2. For example, if we put the number 3 into the machine, we get 6! So, “double(3)” equals 6. This is the double function.
Can you guess what the “half” function does? The “half” function is a mathematical function that performs a very simple operation: it takes a number and divides it by 2. In other words, if you put a number x into the “half” function, you will get half of that number as a result. For example, if you put the number 8 into the “half” function, you get 4.
Now, in more formal mathematics, a function is defined as a relation between two variable magnitudes. This means that for each value of the first magnitude, which in our case we call x, there is a corresponding single value of the second magnitude, which is its image.
The variable that we consider first is the independent variable. The other variable is called the dependent variable because its value depends on the value of the first variable.
A function f between the variables x and y is expressed as follows:
y = f(x)
f(x) is the image of x, i.e., the value that corresponds to x by the function f.
Linear Mathematical Functions
These mathematical functions have the form f(x) = mx + n where:
- m is the slope of the graph of the function. The greater the m the steeper the straight line of the graph.
- n is the origin of the ordinate, which is the value of y when x is equal to 0.
They are also called direct proportionality functions because they express a relationship in which the variables change in the same proportion, which is a key characteristic of these types of mathematical functions.
Example:
y = 2x + 3
This is a linear function where the slope is 2 and the ordinate is 3. The graph of this function is a straight line that passes through the point (0, 3) and has a slope of 2.
There are other types of mathematical functions like quadratic functions that have the form f(x) = ax²+ bx + c or constant functions that have the form f(x) = c, where c is a constant. I invite you to uncover more types such as absolute value, exponential, logarithmic and trigonometric functions among others.
How Are Mathematical Functions Represented?
The graph of a mathematical function is the representation on the coordinate axes of all the pairs (x,y), where x is a value of the independent variable and y is the corresponding value of the dependent variable.
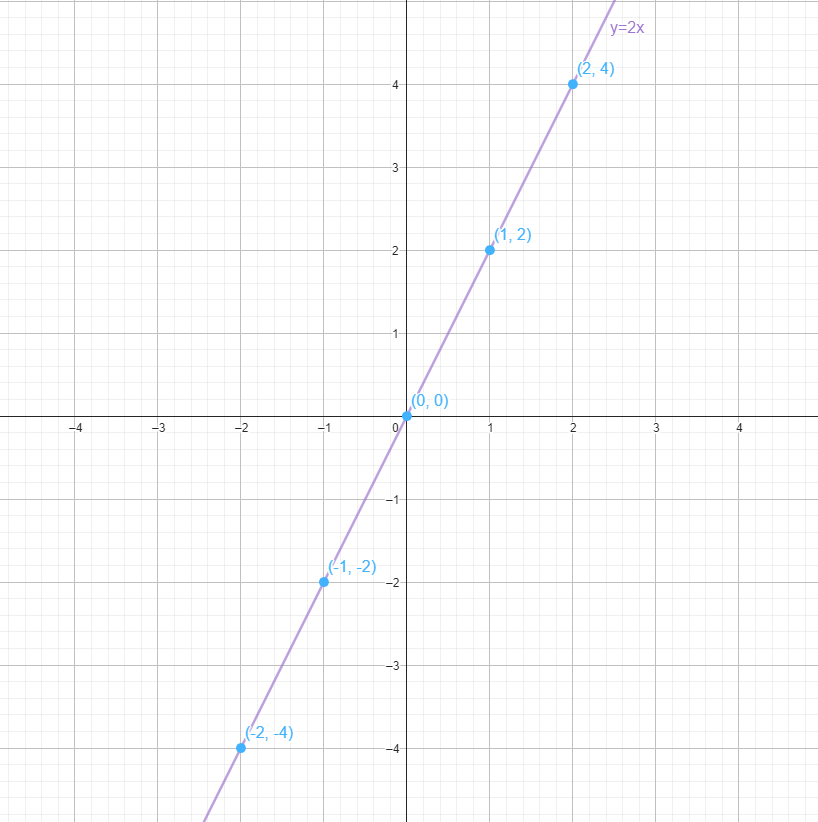
To represent a function, we have to follow several steps. For example, we are going to represent the “double” function which is a linear mathematical function with the slope being 2:
y = 2x
- Draw a coordinate axis: Start by drawing a pair of perpendicular axes on a piece of paper. One axis will be the horizontal axis (called the x-axis) and the other will be the vertical axis (called the y-axis).
- Mark the points on the axes: On the horizontal axis (x-axis), label the values you want to represent. We can mark the following: -4, -3, -2, -1, 0, 1, 2, 3 and the 4. On the vertical axis (y-axis), do the same. Remember that there must be the same distance between the points.
- Make a table of function values: The equation y = 2x tells us how to relate the x-value to the y-value. To find points on the graph, choose several values of x and calculate the corresponding values of y:
- If x=-2 then y=2(-2)=-4. We obtain the point (-2, -4).
- If x=-1 then y=2(-1)=-2. We obtain the point (-1, -2).
- If x=0 then y=2(0)=0. We obtain the point (0, 0).
- If x=1 then y=2(1)=2. We obtain the point (1, 2).
- If x=2 then y=2(2)=4. We obtain the point (2, 4).
- Draw the points: On the graph, place a point at each of the coordinates you found in the previous step.
- Draw the line through the points: Now, connect the points you have drawn with a straight line. The line will pass through all the points you calculated and represent the function y = 2x.
- Label the graph: Add a title to your y = 2x graph.
To represent mathematical functions, we can use the GeoGebra or Desmos graphing calculator. You can choose the one you like the most.
Exercise on Linear Mathematical Functions Applied to Real Life
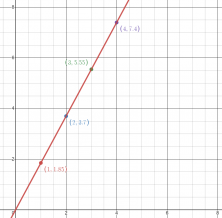
At Leo’s fruit stand, a kilogram of oranges costs $1.85. Answer the following questions:
- Draw up a table of values relating the quantity of oranges to their price.
- Are the kilograms of oranges bought and the price proportional?
- Make the graph of the function obtained.
Solution to the Proposed Exercise
- Draw up the table of values that relates the quantity of oranges to their price.
| x | y |
|---|---|
|
1
|
1,85
|
|
2
|
3,7
|
|
3
|
5,55
|
|
4
|
7,4
|
- Are the kilograms of oranges purchased and the price proportional?
- Yes, the kilograms of oranges purchased and the price are proportional in this case. The reason is that the price per kilogram of oranges is constant ($1.85 per kilogram). This means that if you double the quantity of oranges (for example, from 2 to 4 kilograms), the price will also double. This constant ratio indicates direct proportionality.
- Make the graph of the function obtained.
I hope you found the post interesting, feel free to share it or leave comments below with your questions or the topics you would like to learn more about. To find out more, sign up for Smartick, the online method for learning math for children ages 4 to 14.
Learn More:
- The Language of Functions and Graphs
- What Do Double and Half Mean?
- Difference between Mathematical Constants and Variables
- Elementary Geometry – Open Figures
- Symmetry: What It Is And How to Find It


A multidisciplinary and multicultural team made up of mathematicians, teachers, professors and other education professionals!
They strive to create the best math content possible.