Understanding mode in statistics
Take a look at the following example:
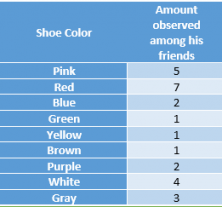
John is going to buy some shoes. To make his decision he wants to know what color is the most popular among his friends. He’s collected some data:

According to the data John collected from his friends, to be in style he should buy red shoes because this is the most popular color among them.
The mode is the data most often repeated, or that appears more frequently, in a collection known as a sample set.
It is a measurement of central tendency used in statistics, as indicated in a previous post on our blog. As well as the average and median, which you can consult in this post, it helps us to better understand the world around us.
Let’s look at another mode example
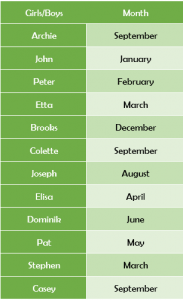
Suppose we want to know which month the boys and girls at a school prefer to practice math with Smartick. We find this information:

Looking at the information you can see which month most users prefer to practice math with Smartick. September appears 3 times, March 2 times, and the other months one time each.
The mode is written as Mo. In the case of this example, Mo: September.
In other words, September is the preferred month for more boys and girls from this school to practice math with Smartick.
You should keep in mind that there will sometimes be samples without a mode. They can be:
- Amodal samples: do not have a mode. For example, in this data sample: 2, 3, 18, 19, 5, 7, 9, 21 you can see that no information is repeated in this group.
- Bimodal samples: there are two modes. For example, in this data sample: 7, 14, 9, 21, 22, 24, 33, 14, 1, 2, 3, 7, the 7 and the 14 repeat with the same frequency (two times), which is why this set has 2 modes.
I’ll leave you with two statistics exercises to solve
1. In the following image of the Smartick development team, what sweatshirt color is the mode, in other words, the color that is repeated the most?

2. And in the following sample, which is the mode? 1, 2, 3, 4, 5, 6, 7, 8, 9, 11, 13, 15, 5, 8, 2, 5.
I invite you to observe the world to continue learning mathematics and statistics without noticing it. You can also practice everyday math with Smartick
Learn More:
- Using Singapore Bars to Solve Algebraic Equations
- How to Solve Subtraction Problems
- Singapore Method: Using the Singapore Bar Models to Solve Problems
- Statistics: What It Is and What It’s Used For
- I Look Like an Engineer


