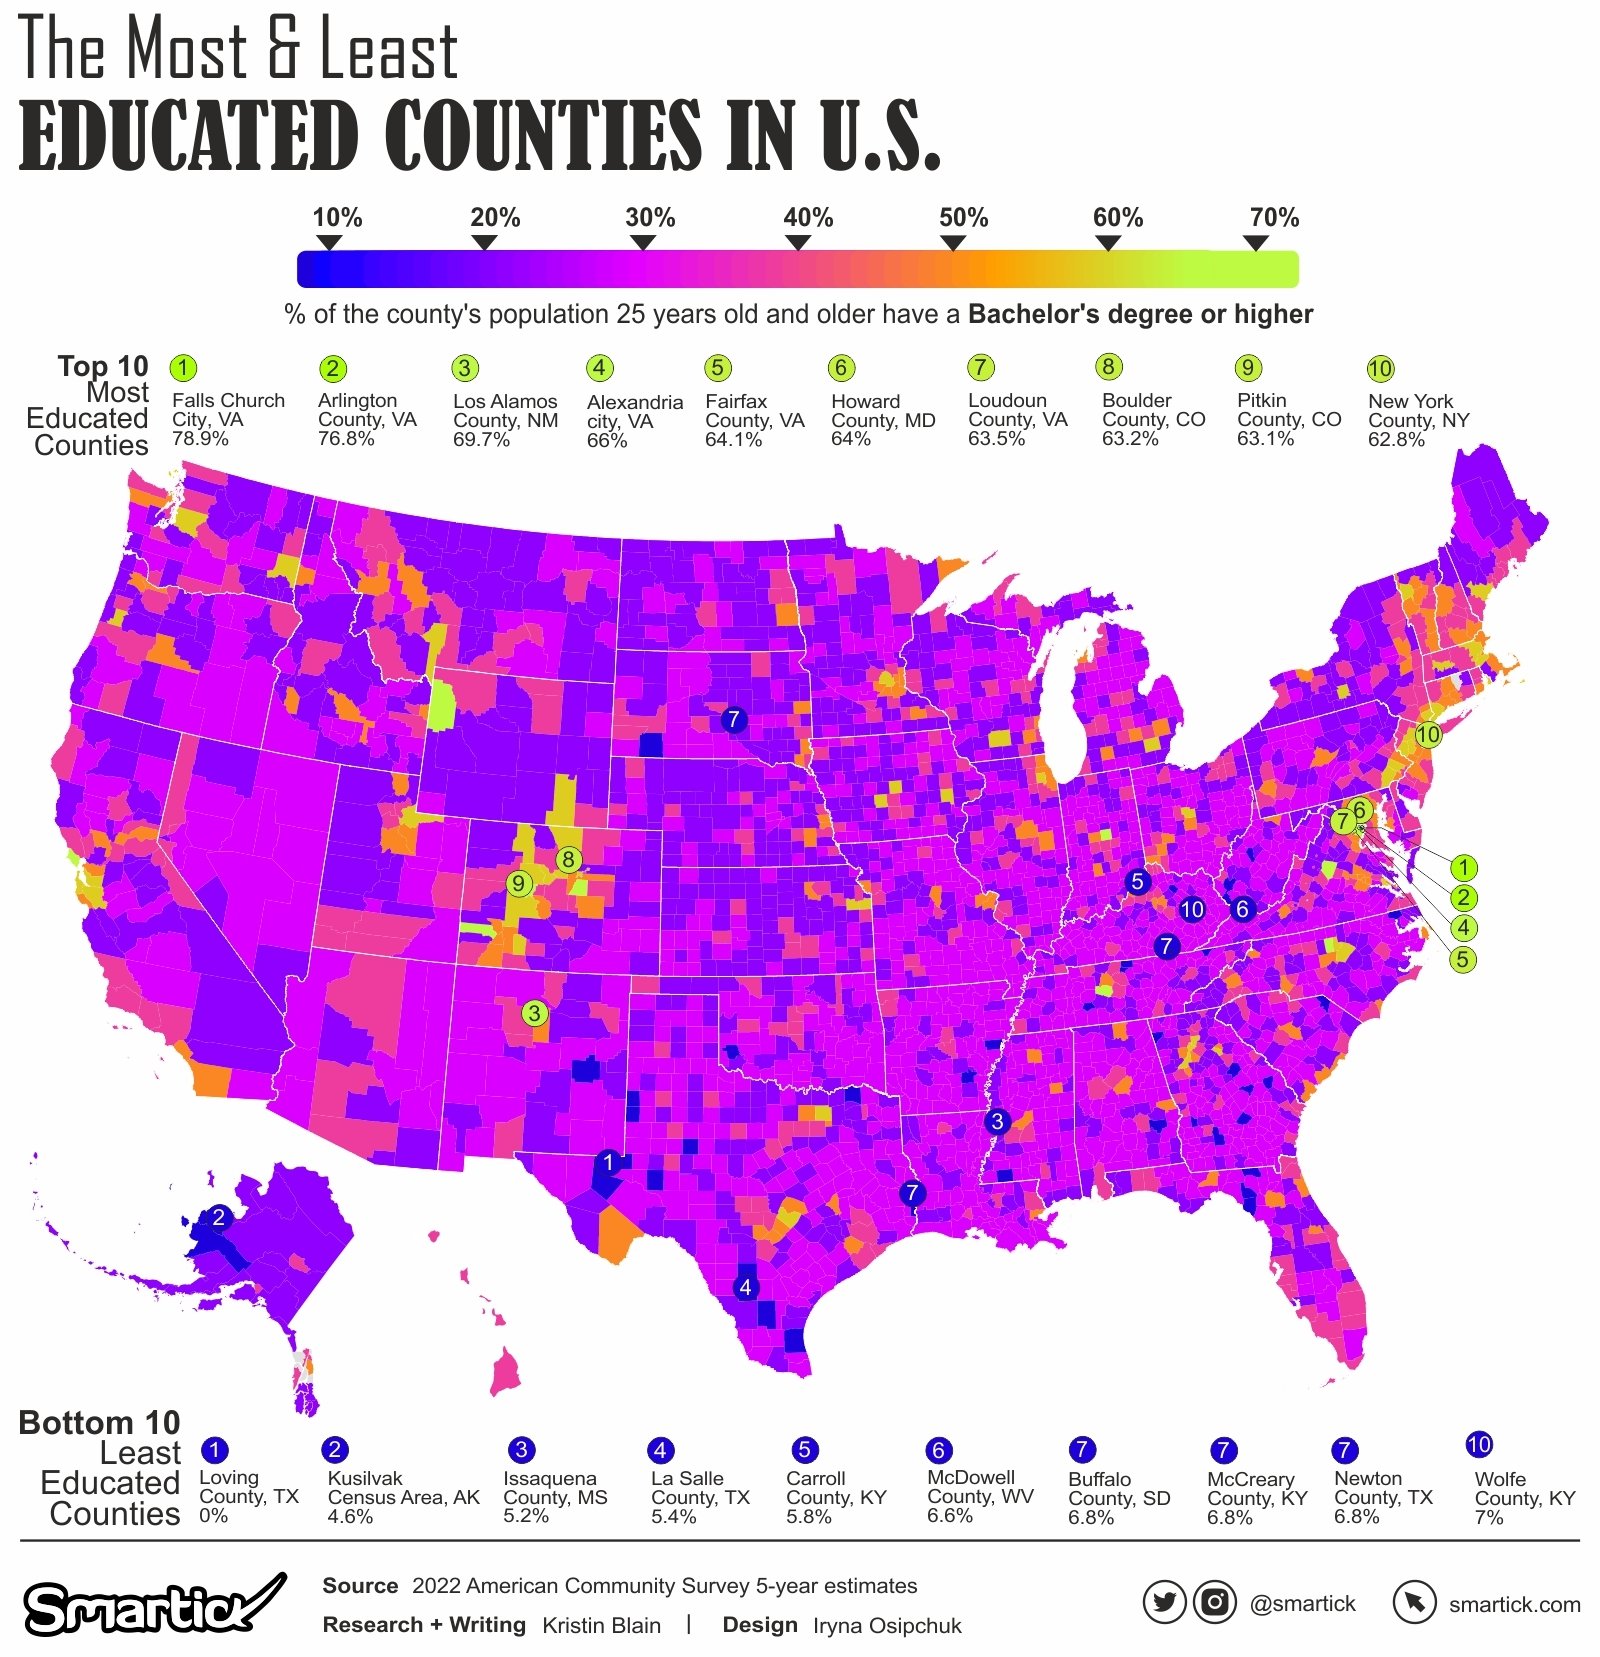
For those pursuing advanced degrees, Falls Church city, Virginia, remains at the forefront with an impressive 48.3% holding Graduate or Professional Degrees. However, a closer look at the bottom of the list reveals striking disparities, with counties like Yakutat City and Borough, Alaska, and Loving County, Texas, reporting percentages as low as 0%.
Through compelling visualizations, we gain insights into the geographic concentration of advanced degree holders, inviting further exploration into the role of education in shaping communities.
Key Findings and Trends
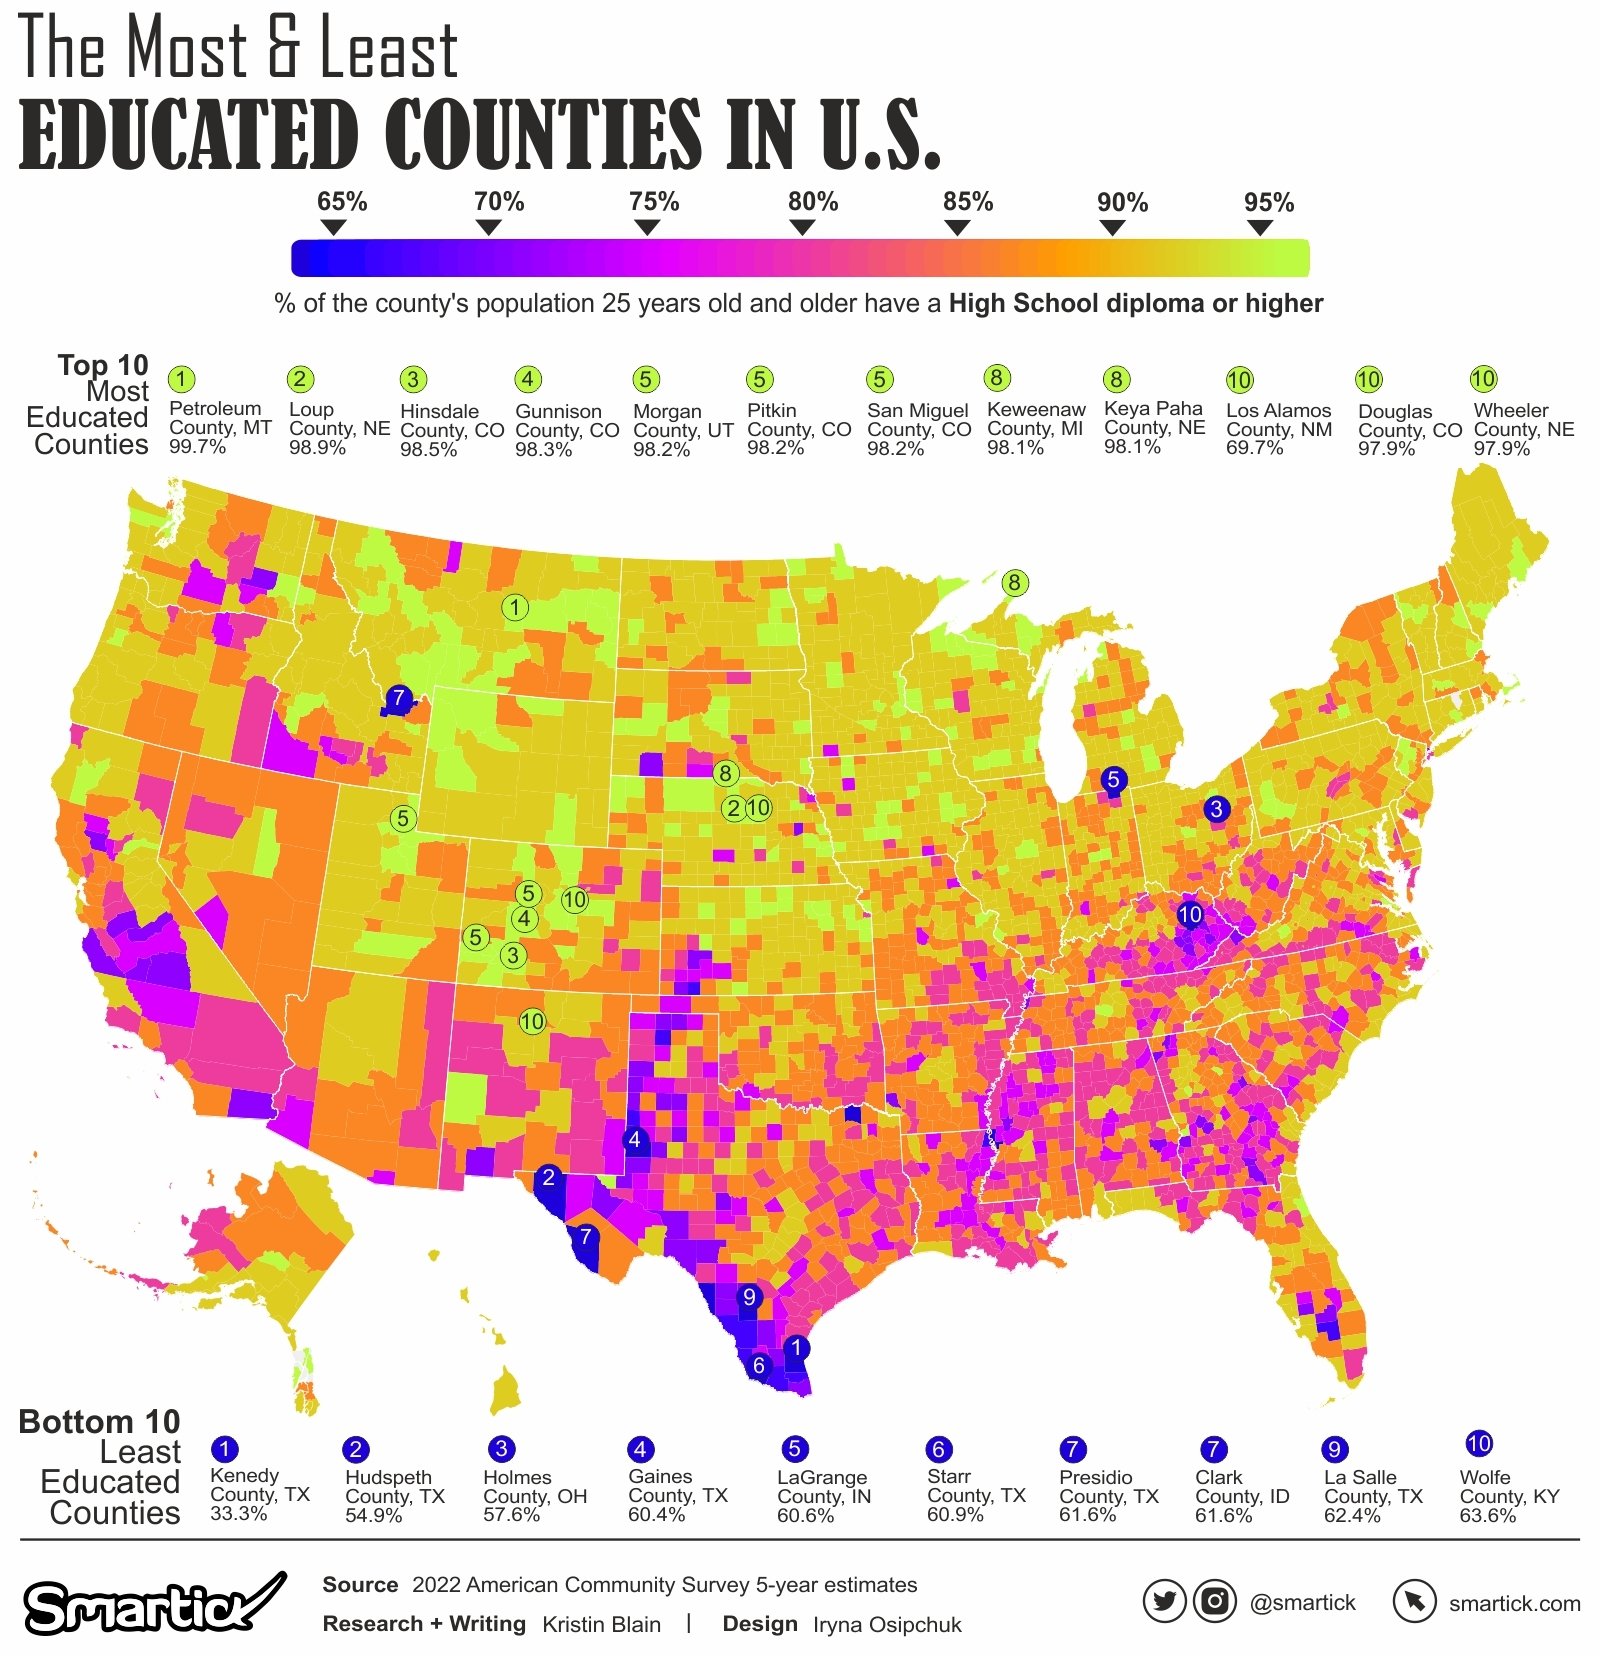
Across all three education levels, certain trends emerge. Counties in Virginia and Colorado consistently rank high, suggesting a correlation between geographic location and educational achievement. Conversely, some counties in Texas and Kentucky consistently struggle, indicating persistent educational challenges that demand attention.
Anomalies in the data prompt critical questions about the underlying factors influencing educational outcomes, paving the way for future research and policy considerations.
Implications and Insights
The educational disparities uncovered in this analysis have significant implications for local policymakers, educators, and community leaders. Addressing these gaps is essential for fostering inclusive development and ensuring equal opportunities for all residents.
This exploration of America’s educational landscape not only serves as a snapshot of the current state but also encourages ongoing efforts to understand and overcome challenges in education.
As we navigate the diverse educational terrain of the United States, it becomes clear that education is not only a personal achievement but a crucial determinant of community success. By shedding light on the most and least educated counties, we aim to inspire conversations, policies, and actions that pave the way for a more equitable and prosperous future.