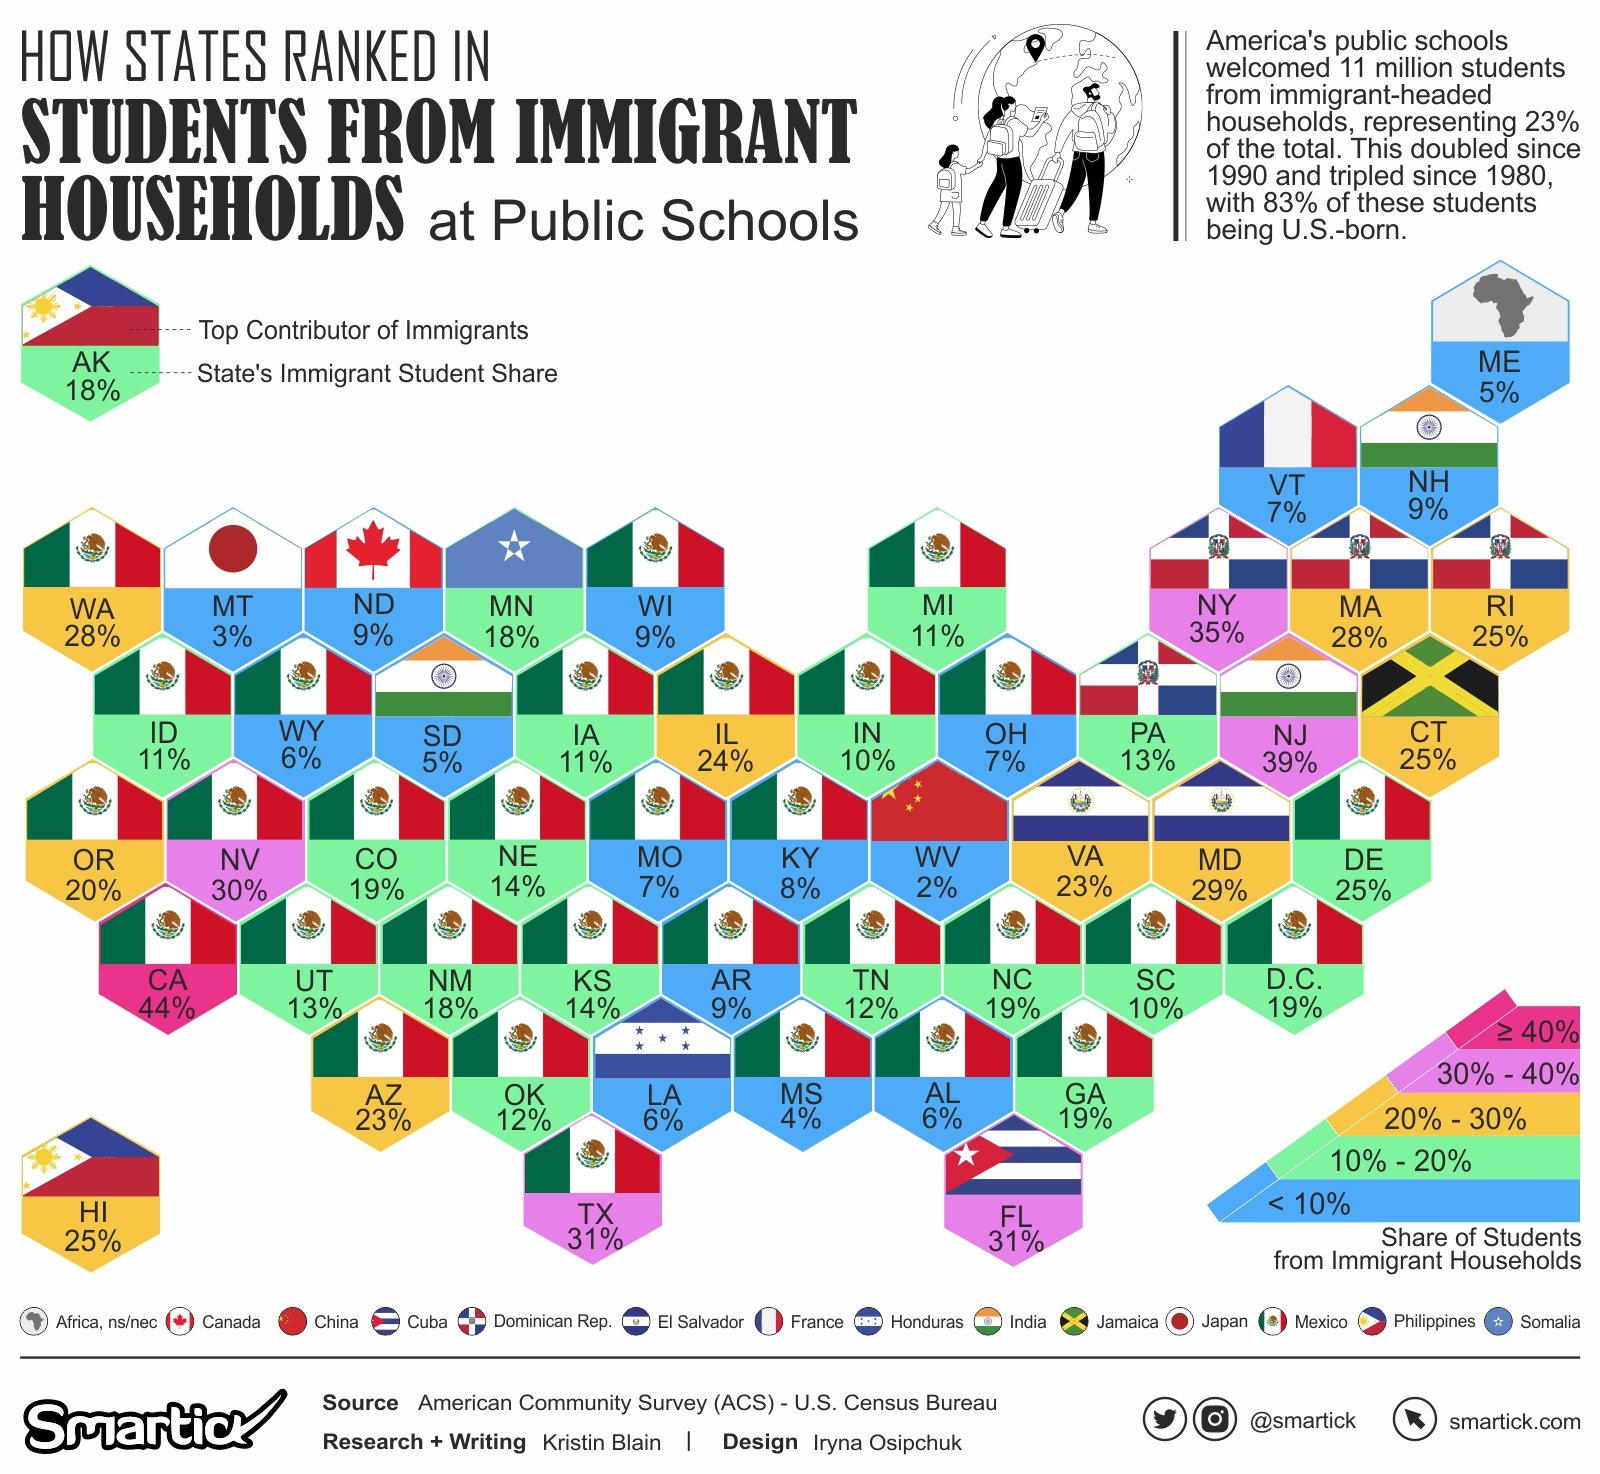
Explore the intricate influence of immigration on U.S. public schools through data-driven analysis. In 2021, 11 million students from immigrant-headed households represented 23% of total enrollment. While 83% of these students are U.S.-born, localized impacts, budgetary challenges, linguistic diversity, and metropolitan dynamics paint a nuanced picture of immigration’s role in education.

In 2021, our nation’s public schools welcomed a staggering 11 million students from immigrant-headed households, representing a significant 23 percent of all students. This figure marks a dramatic increase, with immigration’s influence on public schools doubling since 1990 and tripling since 1980. This surge has raised pivotal questions about assimilation, the process by which immigrants and their children become integral parts of American society.
It’s important to note that the majority of students in immigrant households, approximately 83 percent, were born in the United States. This diversity within immigrant households highlights the complex nature of immigration’s impact on our schools.
Immigration: A Local Phenomenon
One of the striking insights from our analysis is the localized nature of immigration’s effects. On average, there were 55 public school students for every 100 immigrant households, compared to 33 students per 100 native-born households. This discrepancy is influenced by the younger age profile and higher fertility rates of immigrants, coupled with their higher likelihood of sending their children to public schools.
Zooming in further, we find that the impact of immigration is concentrated in specific areas. Only 700 of the 2,351 Census Bureau-designated PUMAs account for a substantial two-thirds of students from immigrant households. In these areas, it’s not uncommon to find that 39 percent of public school students come from immigrant households, with some exceeding 50 percent.
Challenges Faced by Schools
The influx of students from immigrant households has had profound implications for public school budgets. In 2021, there were 66 percent more public school students in the average immigrant household compared to native-born households. This can strain the budgets of local schools, as immigrants tend to have lower incomes, reflected in the median income of immigrant households being approximately 8 percent lower than native-born households.
Additionally, immigrants are less likely to own homes, which has a direct impact on property tax revenue—a primary source of funding for education. This creates a disparity between the increased enrollment and the available financial resources, posing significant challenges for schools in some areas.
A Changing Linguistic Landscape
Another striking aspect of immigration’s impact on public schools is the linguistic diversity it introduces. In 2021, 22 percent of public school students spoke a language other than English at home, compared to 14 percent in 1990 and 9 percent in 1980. This has led to the emergence of schools grappling with the challenges of accommodating students who speak multiple foreign languages, adding a layer of complexity to the educational landscape.
In some areas, there are PUMAs where 10 or more foreign languages are spoken by public school students. This diversity, while enriching, also presents significant challenges for educators.
Metropolitan Melting Pots
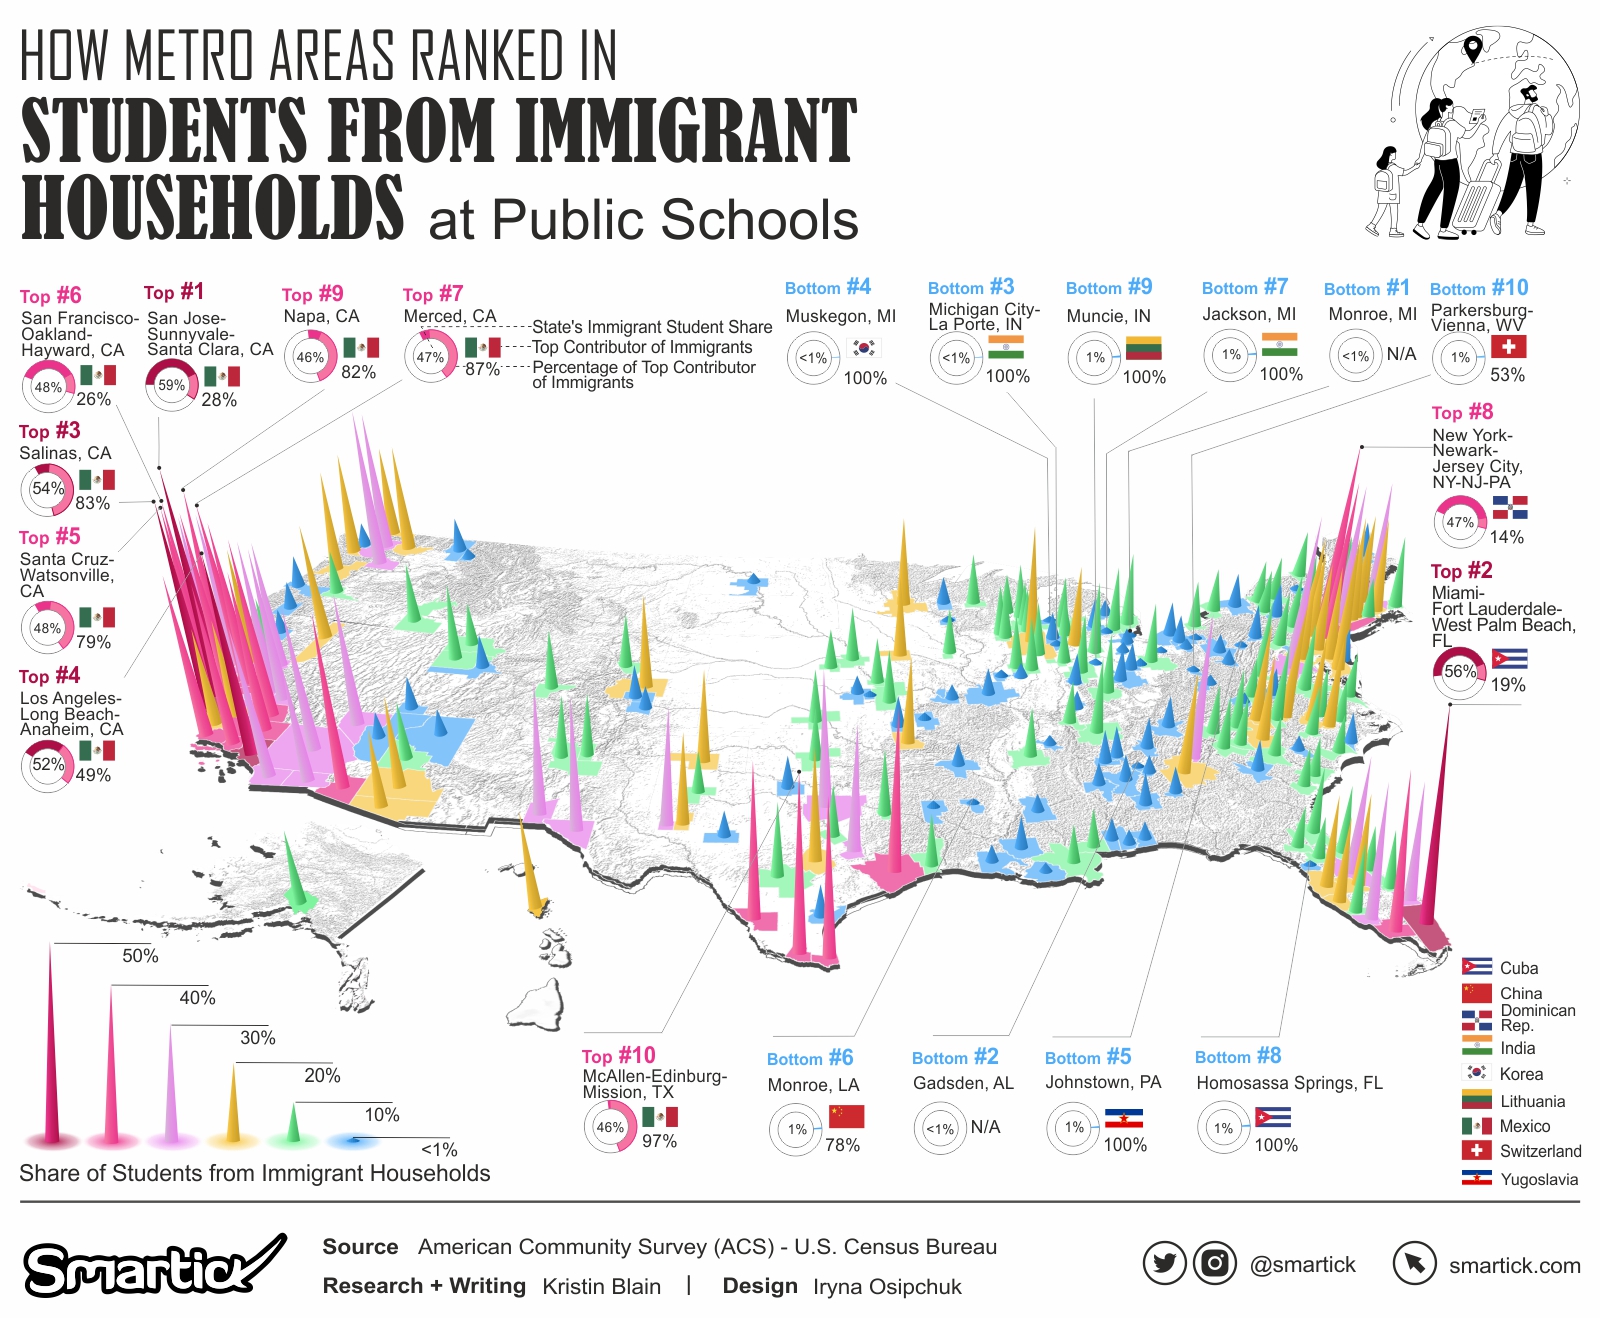
Across the United States, metropolitan areas often serve as melting pots of immigration. In cities like San Jose-Sunnyvale-Santa Clara, Miami-Fort Lauderdale-West Palm Beach, and Los Angeles-Long Beach-Anaheim, public school students from immigrant households constitute a substantial share of the enrollment, with percentages reaching as high as 59 percent.

In numerous major metropolitan regions, some of which encompass multiple PUMAs, a substantial portion of public school enrollment comprises students from immigrant households. Notable examples include:
- 59 percent in San Jose-Sunnyvale-Santa Clara, Calif.
- 56 percent in Miami-Fort Lauderdale-West Palm Beach, Fla.
- 52 percent in Los Angeles-Long Beach-Anaheim, Calif.
- 48 percent in San Francisco-Oakland-Hayward, Calif.
- 47 percent in New York-Newark-Jersey City, N.Y.-N.J.-Pa.
- 42 percent in Houston-The Woodlands-Sugar Land, Texas
- 39 percent in Washington-Arlington-Alexandria, D.C.-Va.-Md.-W.Va.
- 35 percent in Dallas-Fort Worth-Arlington, Texas
- 34 percent in Seattle-Tacoma-Bellevue, Wash.
- 33 percent in Las Vegas-Henderson-Paradise, Nev.
- 30 percent in Boston-Cambridge-Newton, Mass.-N.H.
In conclusion, the impact of immigration on our public schools is a multifaceted issue that deserves thoughtful consideration. It is a testament to the dynamic nature of our society and the diversity that defines us as a nation. While immigration brings numerous opportunities and enriches our culture, it also presents challenges, particularly for our educational institutions.
As policymakers navigate the intricacies of immigration policy, they must factor in the fiscal and assimilation challenges posed by immigration. The balance between welcoming new members into our communities and ensuring the successful integration of immigrants and their children into our society remains a pressing issue—one where numbers matter greatly.
Ultimately, immigration’s impact on public schools reflects the broader conversation surrounding immigration policy, echoing questions about the number of people we should admit into our country. These questions reverberate throughout our society, from our classrooms to our communities, and they are fundamental to shaping the future of our nation.

