This article is brought to you by Smartick, an AI-powered math training app. With just 15 minutes a day, it helps your kids transform into math wizards.
The Individuals with Disabilities Education Act (IDEA) marked a major milestone in making education accessible to all students regardless of their disability. Through IDEA, millions of children with disabilities have received special education services tailored to meet their individual needs.
In this article, we explore how the landscape of disability education has transformed over the past few decades, from 1976 to 2022. We will examine the prevalence of various types of disabilities among students, the evolution of these figures over time, and geographical disparities across states and territories.
The State of Disability Education in 2021-22
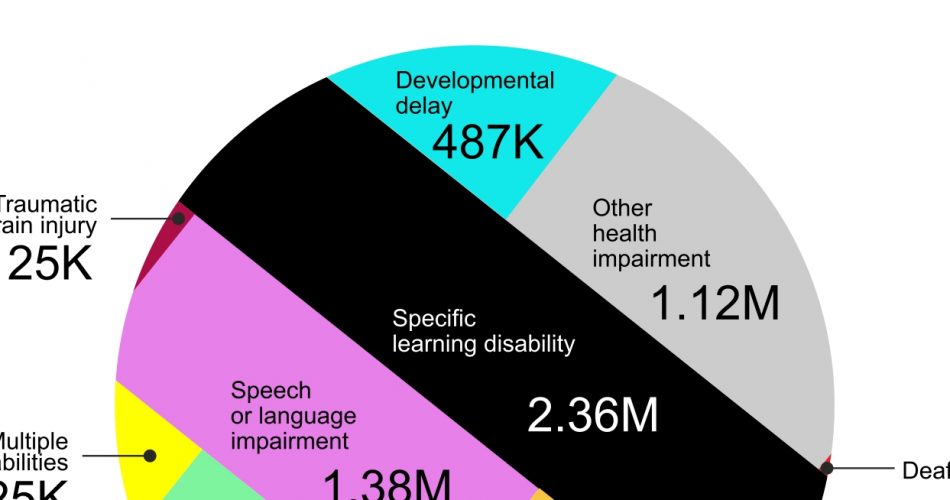
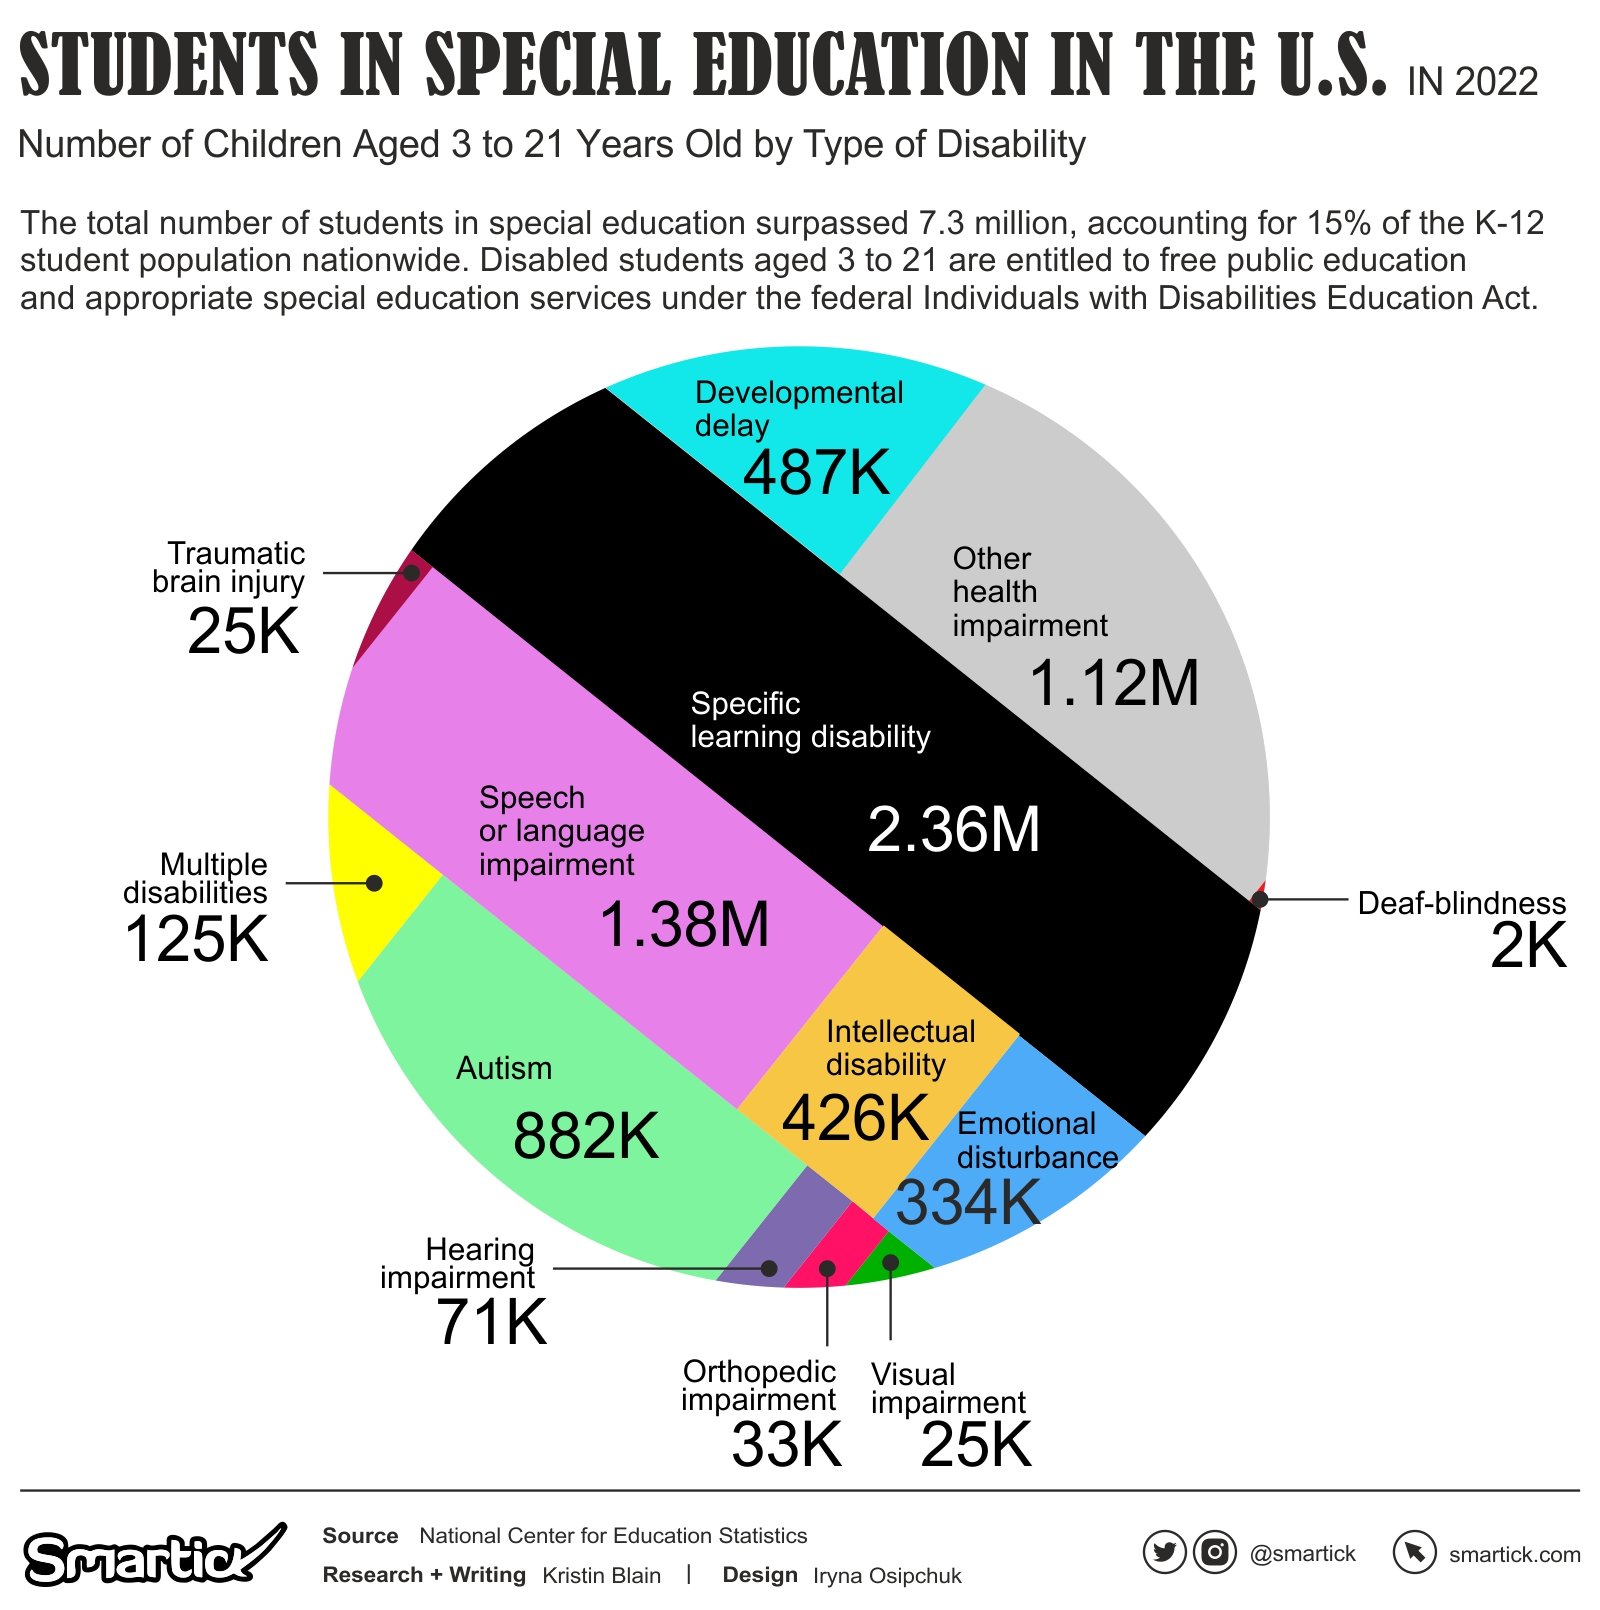
As of the 2021-22 school year, an estimated 7.259 million children aged 3 to 21 are receiving special education services under IDEA. These students have a range of disabilities, with the most common being specific learning disabilities (2.355 million students), speech or language impairment (1.378 million students), and other health impairments (1.116 million students). Autism also represents a significant proportion of the total, with around 882,000 students identified.
The Historical Evolution of Disability Education
Historical data from 1976 onwards highlights some intriguing trends. The total number of students with disabilities served under IDEA has almost doubled, from 3.69 million in the 1976-77 school year to 7.26 million in 2021-22. Interestingly, while certain disabilities such as intellectual disability and emotional disturbance have remained relatively stable or even declined slightly, others like autism and other health impairments have witnessed significant growth.
For instance, in the 2000-01 school year, when data collection for autism began, around 93,000 students were reported. This figure has grown nearly ten-fold to 882,000 students by the 2021-22 school year. Similarly, the category of “other health impairments” has seen an exponential increase from 141,000 students in 1976-77 to over a million students in 2021-22.
Each type of disability shows a unique trend. Students with specific learning disabilities, for instance, saw an increase from 796,000 in 1976-77 to a peak of 2.86 million in 2000-01, after which the number has remained largely steady around 2.3 million. In contrast, the number of students with intellectual disabilities has slightly decreased over time, from 961,000 in 1976-77 to 426,000 in 2021-22, possibly reflecting improved prenatal care, changing diagnostic criteria, or evolving educational practices.
State-by-State Analysis
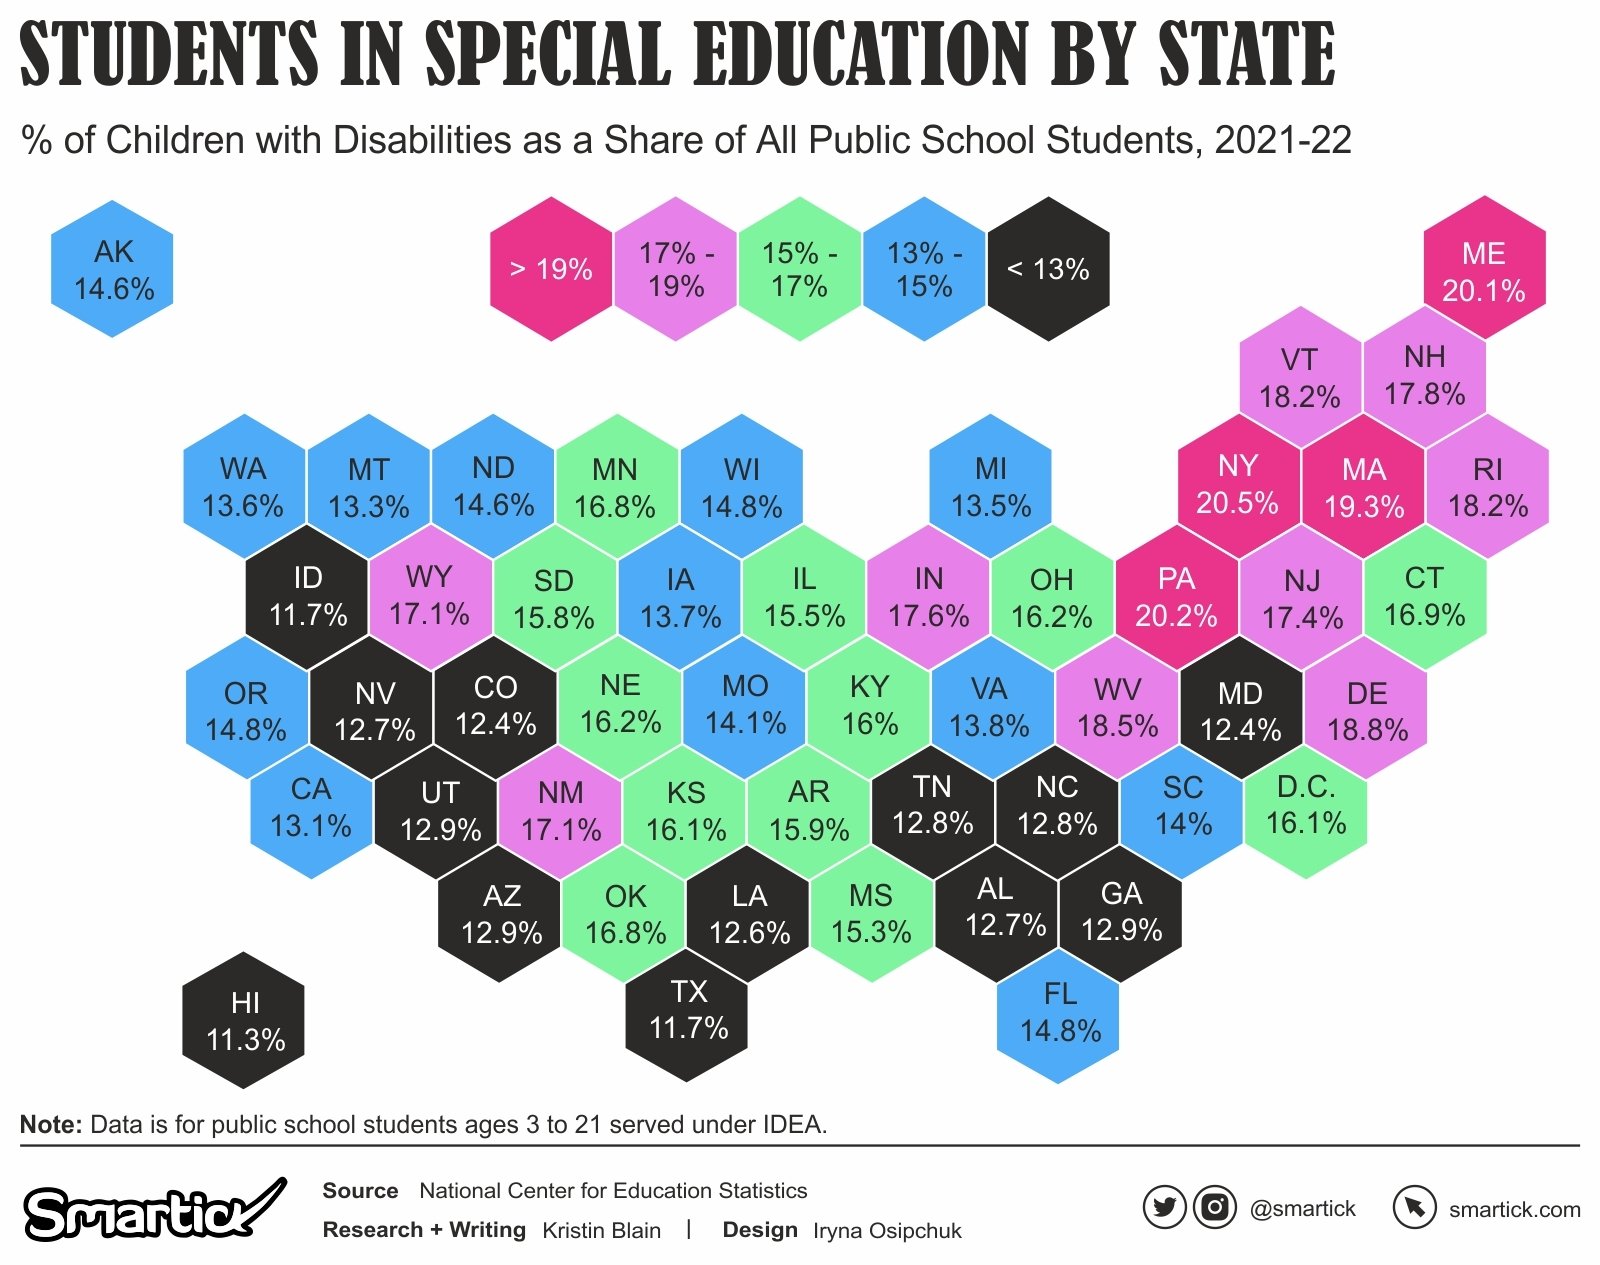
When we break down the data by states, it’s evident that the proportion of students with disabilities varies widely. As of 2021-22, while the national average stands at 14.7%, the figures range from a high of 20.5% in New York and 20.2% in Pennsylvania to a low of 11.3% in Hawaii and 11.7% in Texas and Idaho. The reasons for these disparities could be multifactorial, including differences in state policies, availability of resources, population demographics, or diagnostic practices.
The landscape of disability education in the US has changed dramatically over the past few decades, reflecting advances in medical diagnosis, educational practices, and policy changes. However, the wide disparities across states remind us that there is still much work to be done to ensure equal access to quality education for all students with disabilities. Future research and policy efforts should focus on understanding and addressing these disparities, to ensure that every child, regardless of their disability or geographical location, has the opportunity to reach their full potential.
Share Article:
Mapped: The Literacy Scorecard of America
ADHD Across America: A Deep Dive into Diagnosis and Treatment Trends