

The Human Development Index (HDI), crafted by the United Nations Development Programme, assesses overall development through health, education, and standard of living indices.
This article specifically explores mean years of schooling, delving into its correlation with Gross Domestic Product (GDP) per capita. Our goal is to uncover the intricate relationship between a nation’s educational investments and economic prosperity.
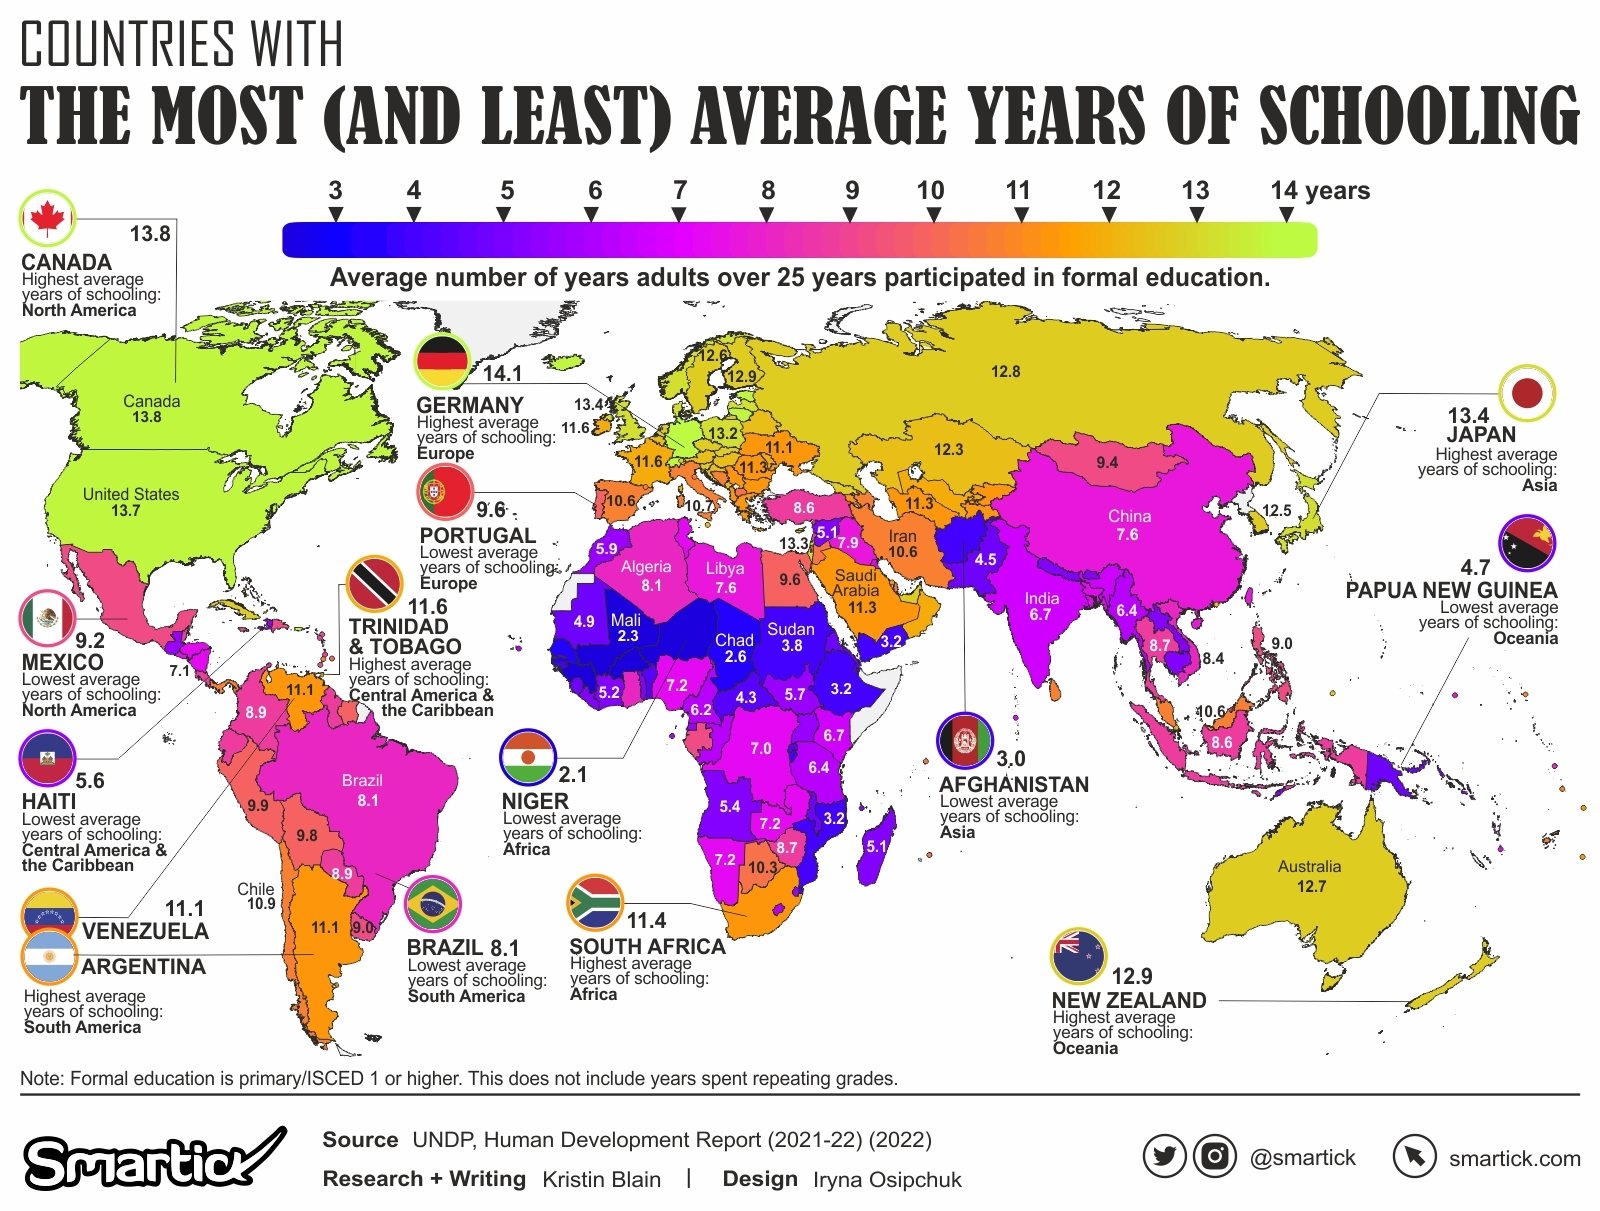
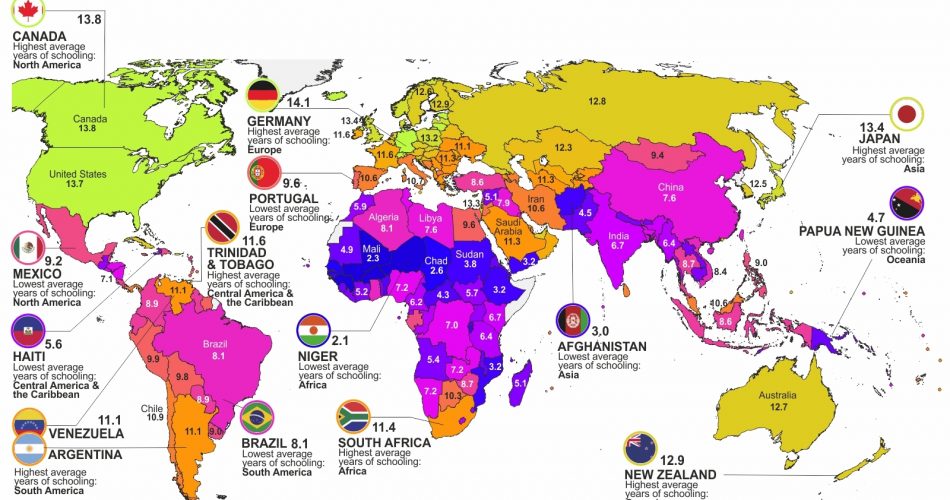
Global Educational Landscape: Top and Bottom Performers
Top 5 Countries in Mean Years of Schooling
- Germany (14.1 years): Germany sets a standard with an impressive mean of 14.1 years of schooling, reflecting a commitment to a robust and extensive education system.
- Switzerland (13.9 years): Following closely behind, Switzerland’s emphasis on education is evident through its high mean years of schooling, contributing significantly to the nation’s overall development.
- Canada (13.8 years): With a strong educational foundation, Canada secures a prominent position in global rankings, underlining the nation’s commitment to fostering a knowledgeable population.
- Iceland (13.8 years): Iceland’s dedication to education is reflected in its mean years of schooling, showcasing the country’s investment in providing a comprehensive and well-rounded learning experience.
- United States (13.7 years): As a global economic powerhouse, the United States maintains a solid position in mean years of schooling, highlighting the nation’s investment in intellectual capital and education.
Bottom 5 Countries in Mean Years of Schooling
- Senegal (2.9 years): At the lower end of the spectrum, Senegal faces significant challenges in mean years of schooling, reflecting a critical need for improvements in its education system.
- Chad (2.6 years): With only 2.6 years of mean schooling, Chad grapples with educational disparities, indicating the necessity for targeted interventions to enhance the quality and duration of education.
- Mali (2.3 years): Mali’s mean years of schooling are notably low, emphasizing the urgent need for educational reforms to uplift the population and contribute to overall development.
- Guinea (2.2 years): Guinea faces substantial educational challenges with a mean of 2.2 years of schooling, signaling the importance of focused efforts to improve access and quality of education.
- Burkina Faso (2.1 years): At the bottom of the list, Burkina Faso confronts significant educational gaps, emphasizing the critical role of education in fostering human development within the country.
These rankings highlight the global disparities in mean years of schooling, emphasizing the need for targeted initiatives to address educational challenges and promote inclusive and comprehensive learning opportunities.
Regional Analysis: Understanding the Interplay of Education and Economic Prosperity
The analysis of mean years of schooling and GDP per capita across regions reveals discernible patterns that align with global economic and educational trends.
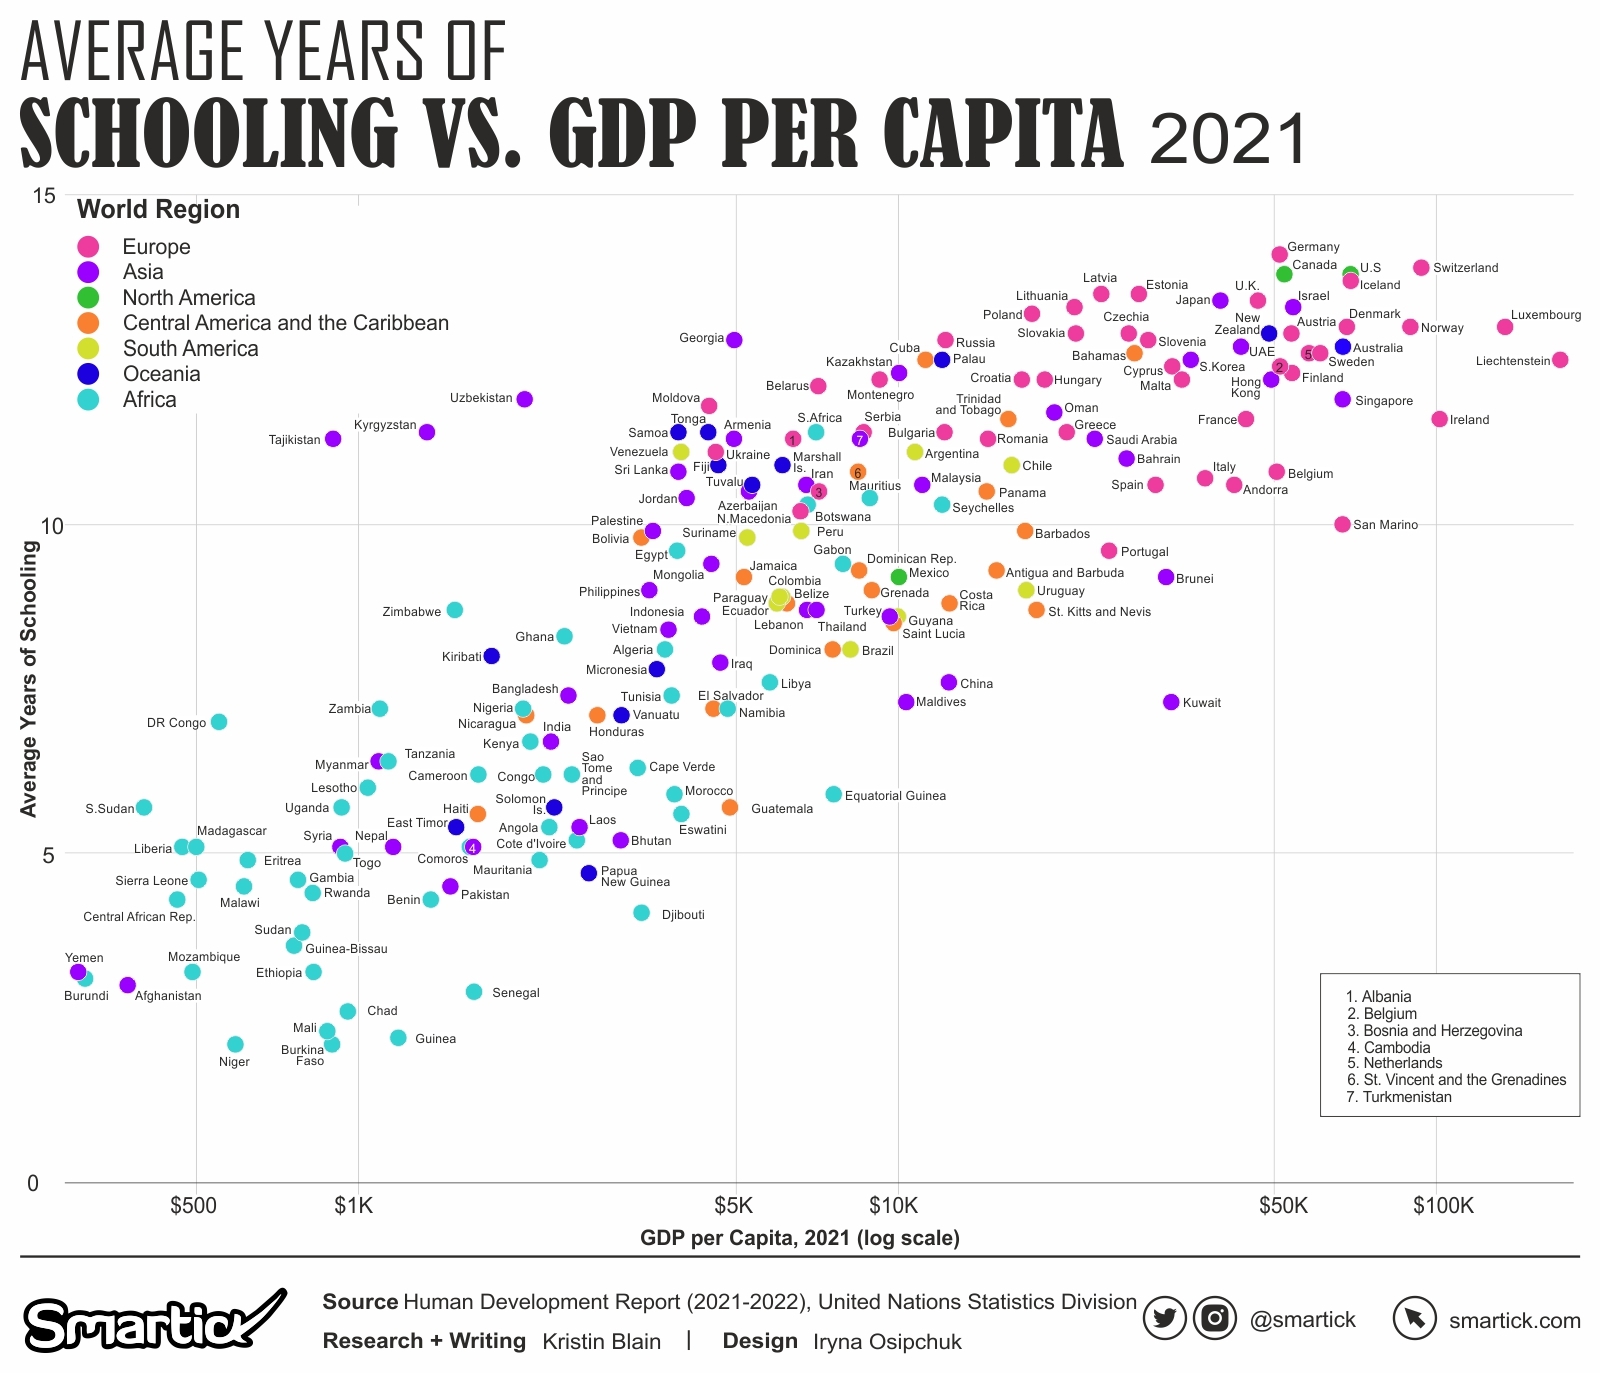
Europe and North America: High Mean Years of Schooling and High GDP
In the high-end spectrum of mean years of schooling and GDP per capita, a concentration of European and North American countries is evident. Germany and Switzerland, representing Europe, exhibit both impressive mean years of schooling (14.1 and 13.9 years, respectively) and high GDP per capita ($51,073 and $93,525, respectively). Similarly, Canada from North America demonstrates a solid mean years of schooling (13.8 years) coupled with a high GDP per capita ($52,112). This pattern aligns with the well-established correlation between a highly educated population and economic prosperity in developed regions.
Africa: Low Mean Years of Schooling and Low GDP
Conversely, a cluster of African countries appears on the lower end of the spectrum in terms of mean years of schooling and GDP per capita. Senegal, with a mean of 2.9 years and a GDP per capita of $1,637, and Chad, with 2.6 years and $955, exemplify this trend. The low mean years of schooling and modest GDP per capita in these countries underscore challenges in economic development linked to educational disparities within certain African regions.
Asia: Moderate Mean Years of Schooling and Diverse GDP
Asia occupies an intermediate position, featuring countries with diverse educational and economic profiles. For instance, China with 7.6 years of schooling and a GDP per capita of $12,437 represents a balance between moderate education and economic development. However, this region showcases substantial variability, with countries like Hong Kong (12.2 years, $49,259) and Japan (13.4 years, $39,650) displaying higher mean years of schooling and GDP per capita, aligning with the European and North American patterns.
South America, Central America, and the Caribbean: A Mix of Averages and Outliers
This region showcases a mix of educational averages and outliers. Brazil (8.1 years, $8,170) represents moderate attainment, while outliers like Chile (10.9 years, $16,265) showcase unique regional patterns. Mexico (9.2 years, $10,046), Argentina (11.1 years, $10,761), and Colombia (8.9 years, $6,104) display varying educational and economic scenarios.
Oceania: Distinctive Outliers in Australia and New Zealand
Australia and New Zealand in Oceania emerge as outliers, boasting both high mean years of schooling and GDP per capita—Australia (12.7 years, $66,916) and New Zealand (12.9 years, $48,824). Their commitment to education and economic development contributes to the distinctive landscape observed across continents.
This comprehensive regional analysis underscores the importance of considering both averages and outliers in understanding the intricate relationship between education and economic prosperity. Tailored strategies for each region, addressing the specific challenges and opportunities presented, are crucial for fostering inclusive development on a global scale.