

This article is brought to you by Smartick, an AI-powered math training app. With just 15 minutes a day, it helps your kids transform into math wizards.
Math is a core school subject and a key player to success in entering the ever-expanding field of lucrative STEM careers. However, mastering the broad disciplines of numeracy is no easy task—and the state a student lives in plays a major role in their mathematical outcomes. According to the latest SAT score report released by CollegeBoard, math achievement in America is in no way united.
Despite changes in college admissions policies during the COVID-19 Pandemic, 45% of high school seniors across the U.S. still participated in the 2022 SATs. But, not all states participated equally; and the number of participants is fundamental to gaining a true understanding of the math skill profile of a state’s senior class.
In a country where each state sets its own educational policies and practices, the United States epitomizes a variegated patchwork of high and low performance rates in the face of nationally-standardized testing. So, while other ‘Top Ten’ or ‘Best and Worst’ lists may serve the supercilious aesthetic of an already-divided nation on the front of mathematics education and achievement, it might be worthwhile to take a closer look at what factors are actually populating these honor rolls.
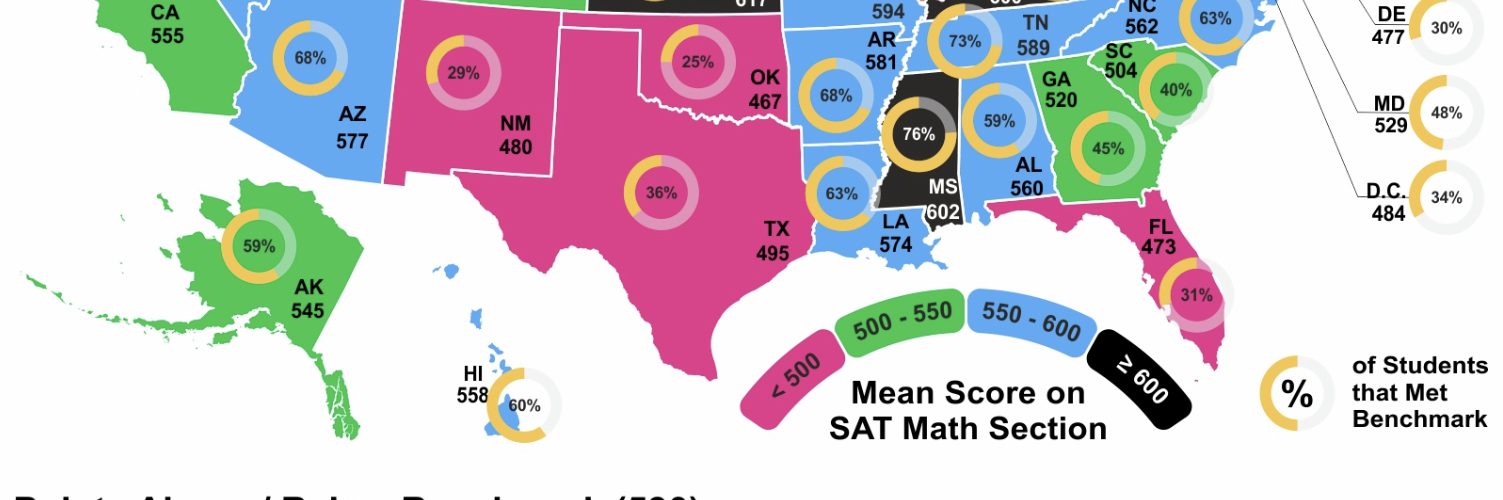
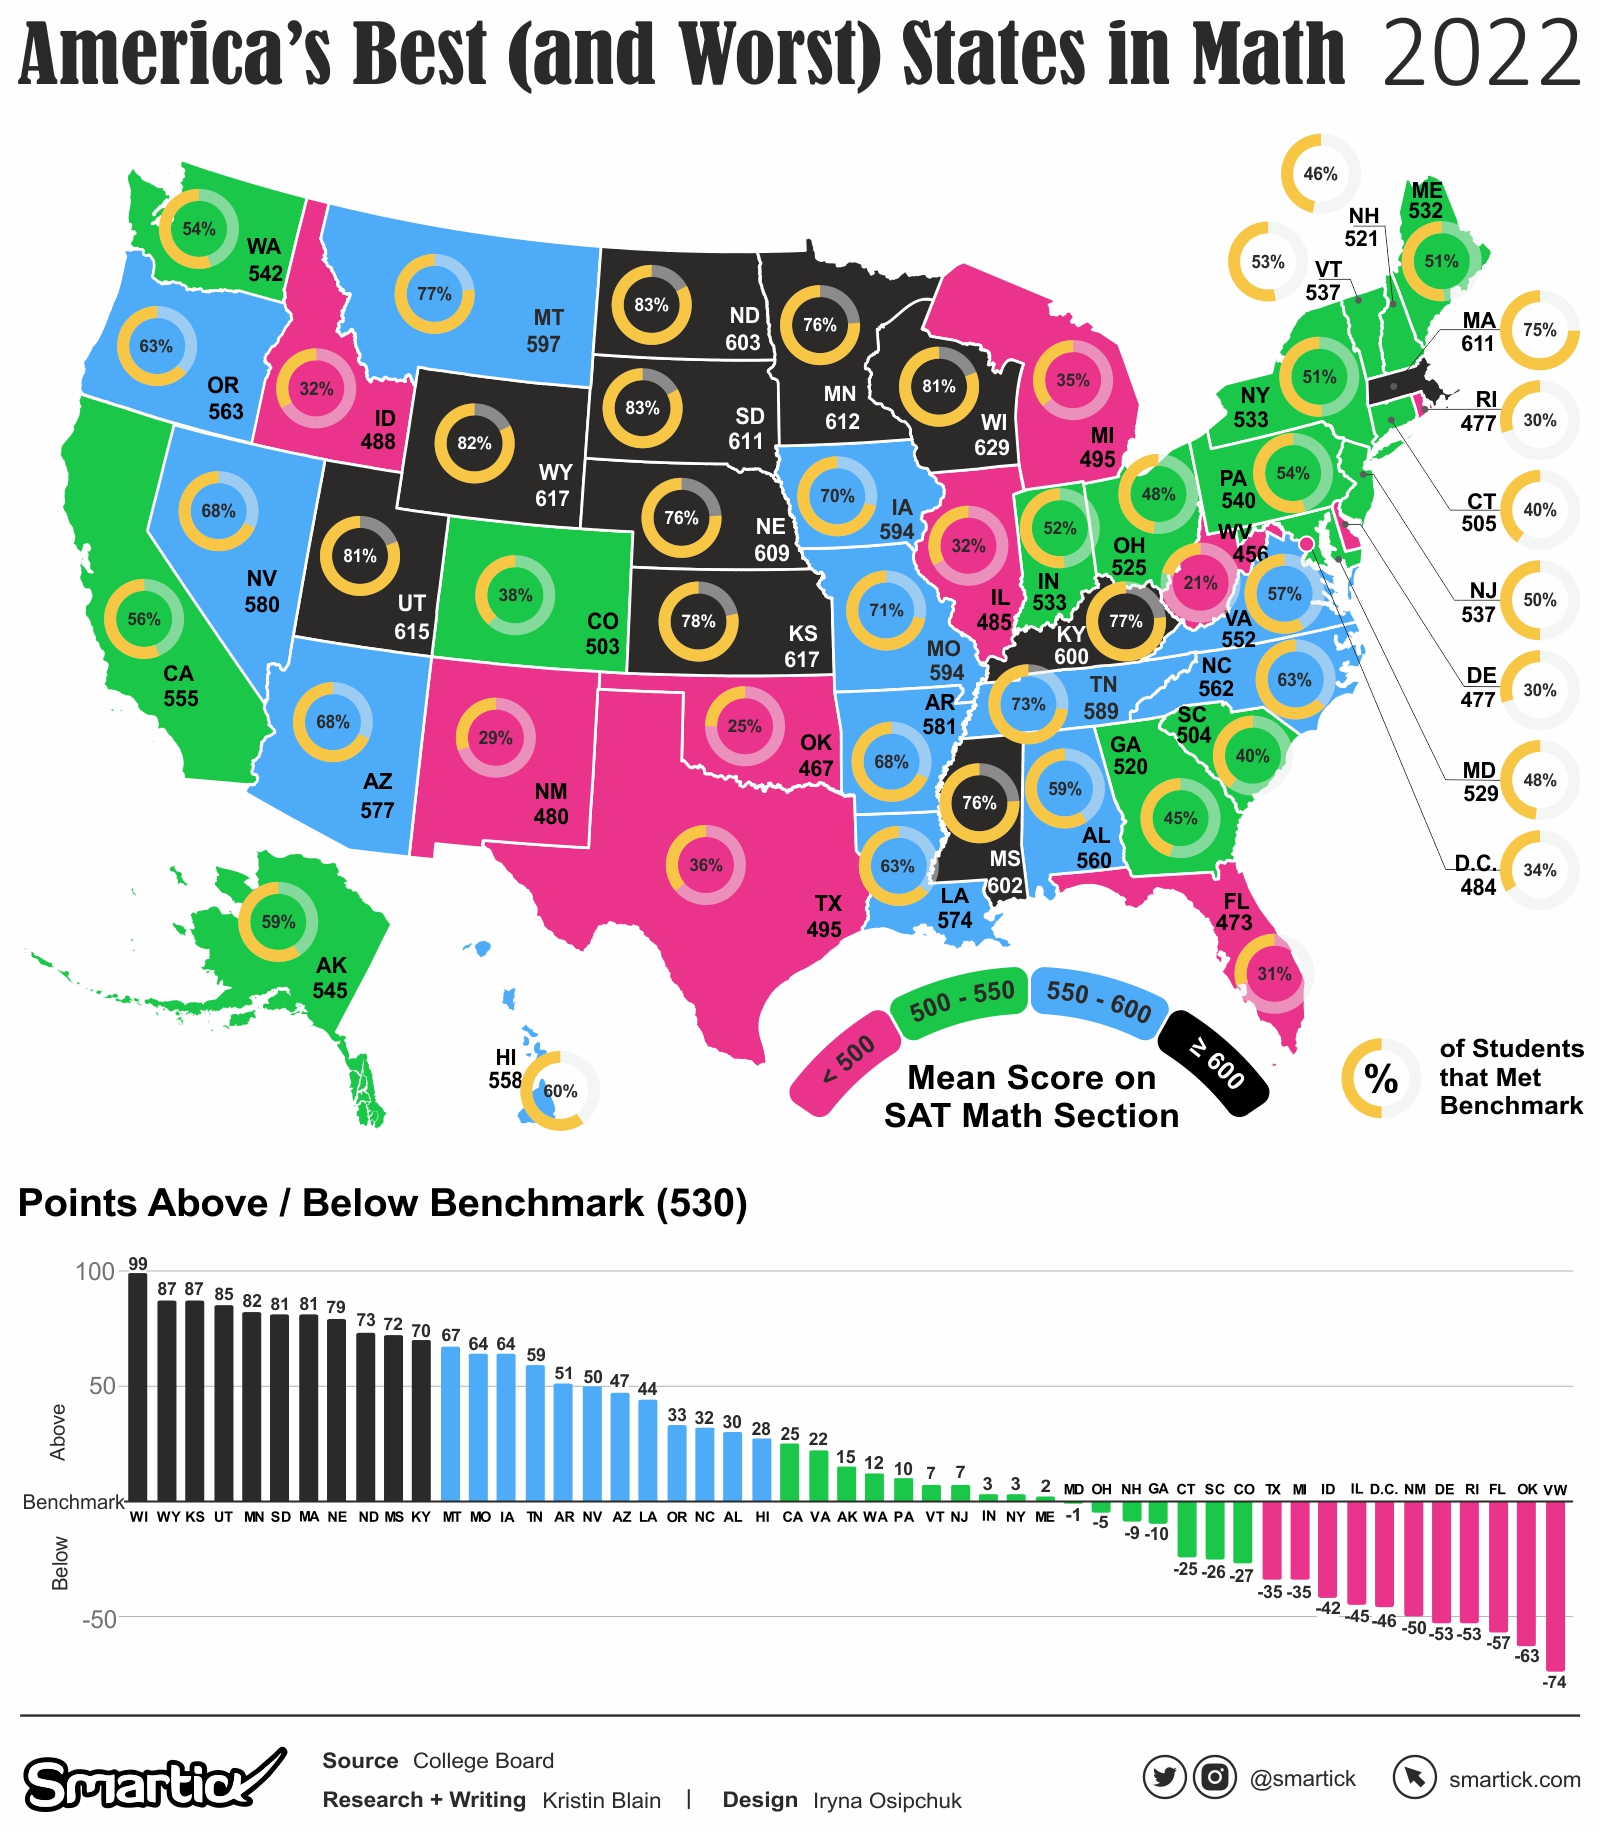
A score of 521 represents the current benchmark for college readiness in Mathematics on the SATs. Below are the top highest and lowest-performing states based on this mean score.
Highest-Performing States on Math SATs Scores
| Rank | State | Mean Score |
| 1 | Wisconsin | 629 |
| 2 | Kansas | 617 |
| 3 | Wyoming | 617 |
| 4 | Utah | 615 |
| 5 | Minnesota | 612 |
| 6 | Massachusetts | 611 |
| 7 | South Dakota | 611 |
| 8 | Nebraska | 609 |
| 9 | North Dakota | 603 |
| 10 | Mississippi | 602 |
In 2022, Wisconsin topped the list for students with the highest average SAT scores in Mathematics.
Although Wisconsin lands in first place for the highest SAT Math score at 629 points—108 points higher than the nation’s average—it also had one of the nation’s lowest number of test takers. In 2022, only 2% of Wisconsin’s high school seniors participated in the SATs.
Lowest-Performing States on SATs Math Scores
Higher participation rates decrease overall SAT scores, and this factor becomes starkly evident when examining data from the lowest-performing states.
Falling 65 points short of the national average for the SAT in Mathematics and at a high participation rate of 84%, it’s clear that West Virginia’s high school seniors are in the poorest shape for math achievement.
| Rank | State | Mean Score | % of HS seniors that participated |
| 1 | West Virginia | 456 | 84% |
| 2 | Oklahoma | 467 | 17% |
| 3 | Florida | 473 | 87% |
| 4 | Rhode Island | 477 | 93% |
| 5 | Delaware | 477 | 95% |
| 6 | New Mexico | 480 | 42% |
| 7 | District of Columbia | 484 | 100% |
| 8 | Illinois | 485 | 97% |
| 9 | Idaho | 488 | 97% |
| 10 | Texas | 495 | 64% |
Texas, West Virginia, and New Mexico have some of the lowest graduation rates in the country. Teacher shortages in the past several years have also led state legislators in Florida and Illinois to the lower requirements for becoming a public school teacher. Oklahoma, Florida and Texas use state-developed mathematics curriculum that does not align with the Common Core State Standards, putting their students at further risk of not meeting standardized testing benchmarks for college admissions.
Below the Surface of Sweeping SAT Scores
Too often, standardized test scores like the SATs are taken at face value—and examining trends that are not always apparent with one three-digit number can serve to inform us about the fundamental errors of superficial comparisons.
So instead of comparing yourself with how “good” or “bad” your own math score is, try a growth mindset approach to your numeracy skills. Take the SAT Math Diagnostic Test to help determine which math concepts you understand and which ones require more attention. Or, dive right into CollegeBoards’s practice SAT tests to prepare yourself for achieving your personal best.