Mathematics Across Borders: Unveiling Patterns in PISA Scores from 2003 to 2022
This article is brought to you by Smartick, an AI-powered math training app. With just 15 minutes a day, it helps your kids transform into math wizards.
In the ever-evolving landscape of global education, the Programme for International Student Assessment (PISA) stands as a beacon, offering invaluable insights into the academic performance of 15-year-olds across the world. Building on our recent explorations of PISA 2022, this article delves into a historical perspective, analyzing PISA math scores from 2003 to 2022. Let’s unravel the trends, successes, and challenges that have shaped the mathematical landscape on a global scale.
Examining Growth: Countries with Remarkable Improvements
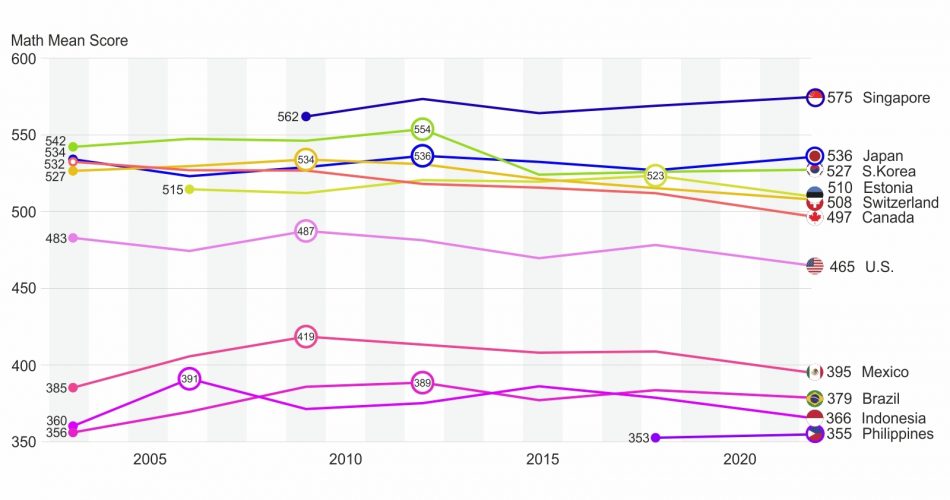
Delving into the rich tapestry of PISA data, certain nations emerge as beacons of educational progress. Singapore, with its consistent and impressive growth in scores across multiple PISA assessments, shines as a global leader in educational excellence. The city-state not only demonstrates mathematical prowess but excels across reading and science domains, showcasing a holistic approach to education. Additionally, Brazil, amid its ongoing challenges, has carved a path of improvement in its educational landscape. Strategic interventions are crucial for sustaining and accelerating this positive trend.
Identifying Challenges: Countries with Persistent Declines
While success stories unfold, challenges persist in some corners of the globe, impeding educational progress. The United States, despite its relative strengths in reading and science, grapples with a concerning decline in math scores, hitting an all-time low in 2022. The intricate web of challenges demands a nuanced approach, addressing socio-economic disparities, adapting to evolving educational environments, and implementing targeted interventions for math education.
Comparative Analysis: U.S. PISA Math Scores
Analyzing PISA math scores in the United States from 2000 to 2022 provides insights into the nation’s educational landscape. Notable findings include:
In 2003, the U.S. recorded a baseline math score of 483, reaching a peak of 487 in 2009 before a recent decline to 465 in 2022.
While U.S. students performed close to the OECD average in mathematics, reading, and science, the latest data reveals a concerning drop in math proficiency.
Socio-economic divides persist, with students in the top 25% outperforming their disadvantaged counterparts by 102 score points in mathematics.
Gender differences are evident, with boys outperforming girls in math and girls excelling in reading. However, challenges persist for both genders.
The impact of COVID-19 on education is evident, with school closures and remote learning presenting challenges and opportunities for improvement.
In conclusion, the comparative analysis of U.S. PISA math scores reflects a complex educational landscape marked by challenges and opportunities. The findings underscore the need for targeted interventions to enhance math education, address socio-economic disparities, and adapt to evolving educational environments, ensuring that students are well-prepared for future success.
Share Article:
PISA 2022: Uncle Sam vs. the World in Math, Reading, and Science
Which School Subjects Are Important for Americans Today?