Crunching the Numbers: How Much Funding Do Public Schools Get?
This article is brought to you by Smartick, an AI-powered math training app. With just 15 minutes a day, it helps your kids transform into math wizards.
Ensuring quality education for students in the United States heavily relies on the funding received by public schools. To understand how the money flows and where it goes, we need to dive into the intricate world of school funding. In this article, we’ll take you on a journey through the 2021 Annual Survey of School System Finances, unveiling valuable insights and figures that shape the landscape of public school funding.
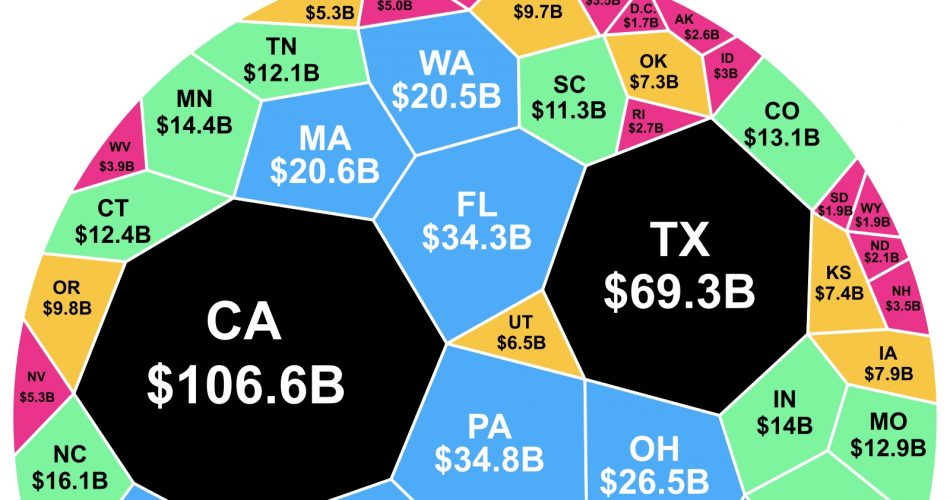
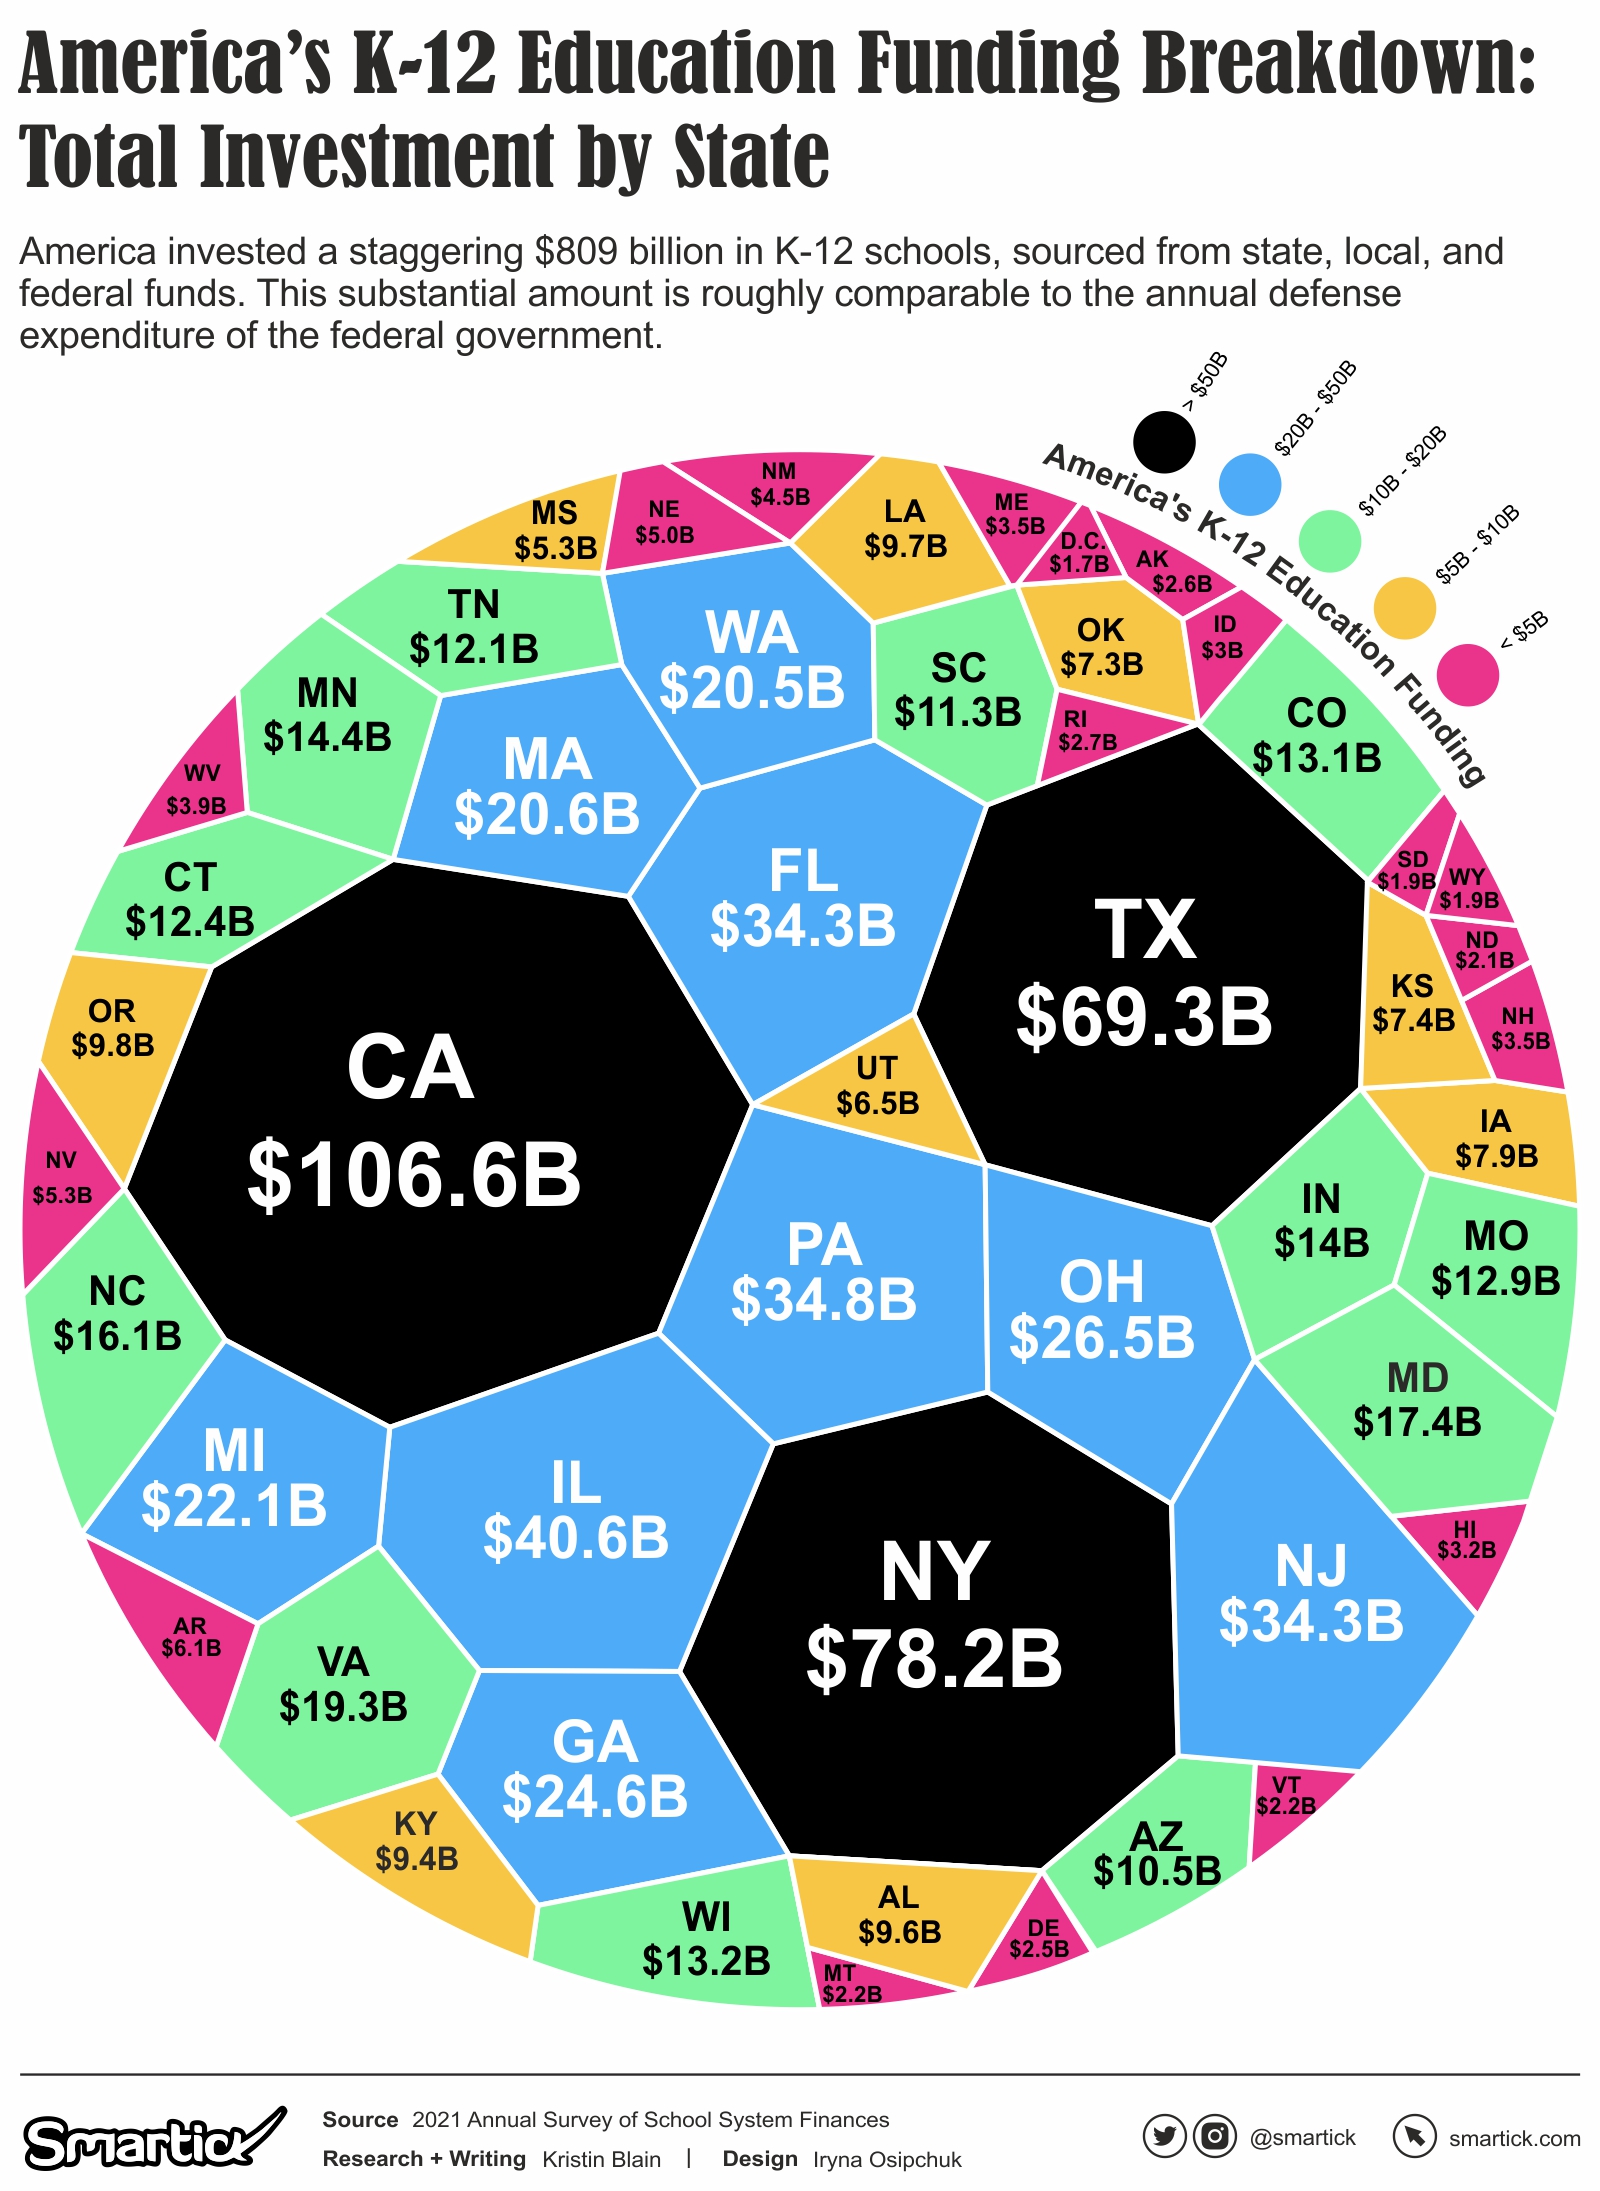
During the 2020-2021 school year, an impressive $809 billion was invested in K-12 schools across the nation. This substantial increase of $38 billion compared to the previous year can be attributed to the influx of pandemic relief aid approved by the federal government. This much-needed financial boost amounted to nearly $200 billion, making a significant impact on the overall funding picture.
Key Highlights
California received the highest funding with $106.6 billion, followed by Texas with $69.3 billion.
New York had a substantial funding of $78.2 billion.
Pennsylvania, New Jersey, and Florida also received significant funding, amounting to $34.8 billion, $34.3 billion, and $34.3 billion, respectively.
The states with the lowest funding were North Dakota with $2.1 billion and Wyoming with $1.9 billion.
How Much is Spent on Each Student?
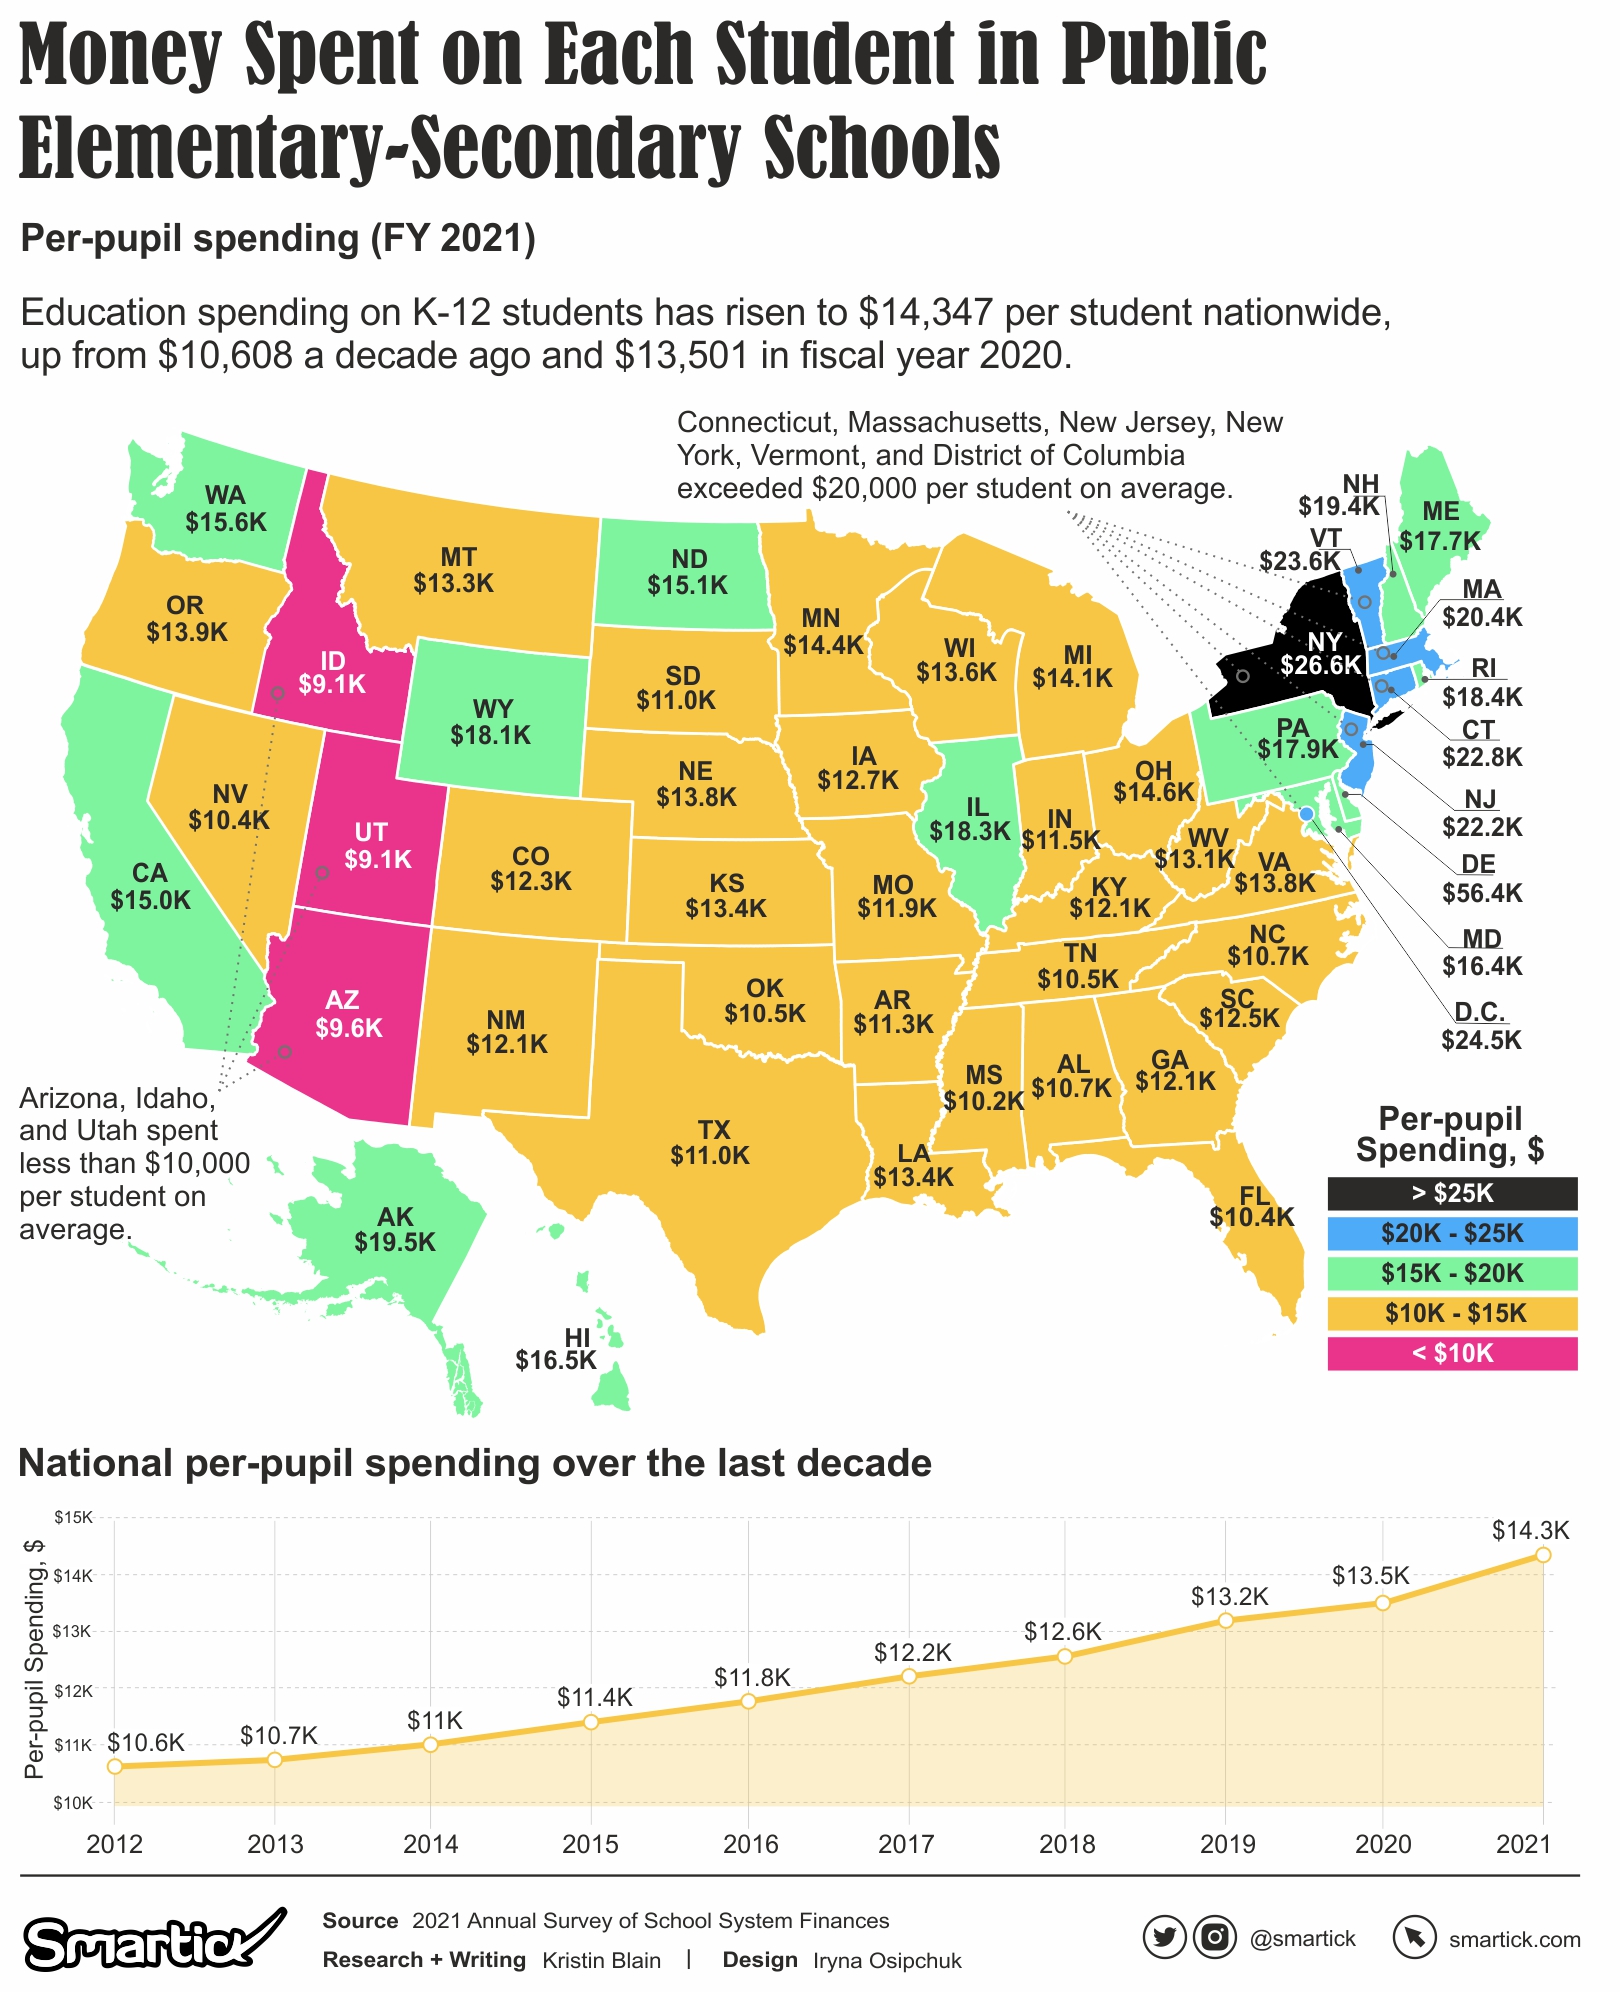
Nationally, the average amount spent per student has reached $14,347, an increase from $13,501 in fiscal year 2020 and $10,608 a decade ago. When adjusted for inflation, per pupil funding has risen by approximately $1,800 over the last ten years, reflecting the ongoing commitment to supporting students’ diverse needs. Let’s dive into per student spending in every state.
Key Highlights
In three states, namely Arizona, Idaho, and Utah, the average spending per student was below $10,000, with each state allocating approximately $9,600 per student. However, compared to the previous year, the number of states falling into this category decreased significantly, as five additional states were included last year.
Five states, along with Washington, D.C., surpass the $20,000 mark in average spending per student, more than doubling the investment of the lowest-spending states. These states include Connecticut, Massachusetts, New Jersey, New York, and Vermont. Notably, in some of these states, significant urban districts like Boston and New York City contribute to the overall state average due to higher costs associated with educating children in those areas.
In conclusion, the analysis of the 2021 Annual Survey of School System Finances provides valuable insights into the landscape of public school funding in the United States. The significant increase in investment, reaching $809 billion during the 2020-2021 school year, highlights the impact of federal pandemic relief aid. California emerged as the state with the highest funding, followed by Texas and New York. Nationally, per student spending has risen to an average of $14,347, reflecting a commitment to addressing the diverse needs of students. While some states continue to allocate less than $10,000 per student, the number has decreased compared to the previous year. On the other hand, several states, along with Washington, D.C., invest over $20,000 per student, driven by factors such as significant urban districts with higher educational costs. These findings underscore the importance of equitable and adequate funding to ensure quality education for all students across the country.
Share Article:
Visualizing the World’s Most Widely Spoken Languages in 2023
Exploring Today’s Best Mathematics Scientists in the World