

In the world of education, a persistent question looms large: Does spending more money lead to better academic results? Smartick examined the data from the Program for International Student Assessment (PISA) 2018 to shed light on this very question.
The Correlation Between Spending and Scores
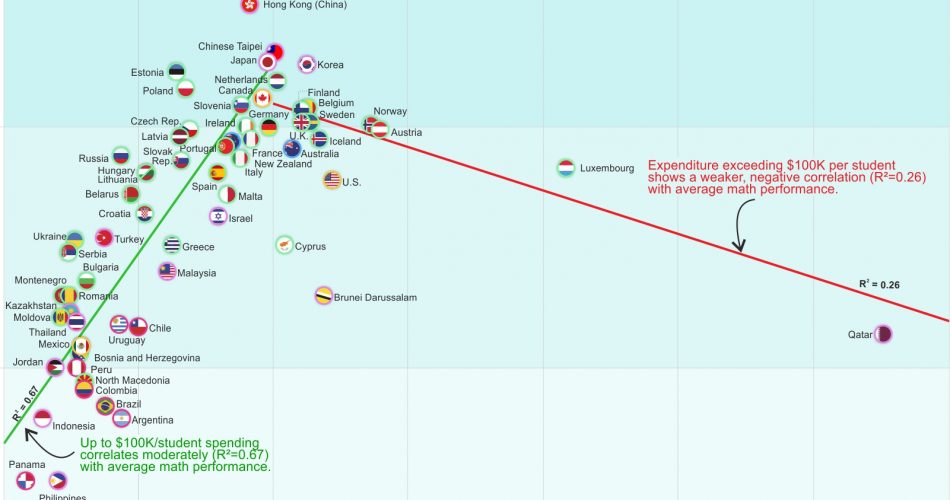
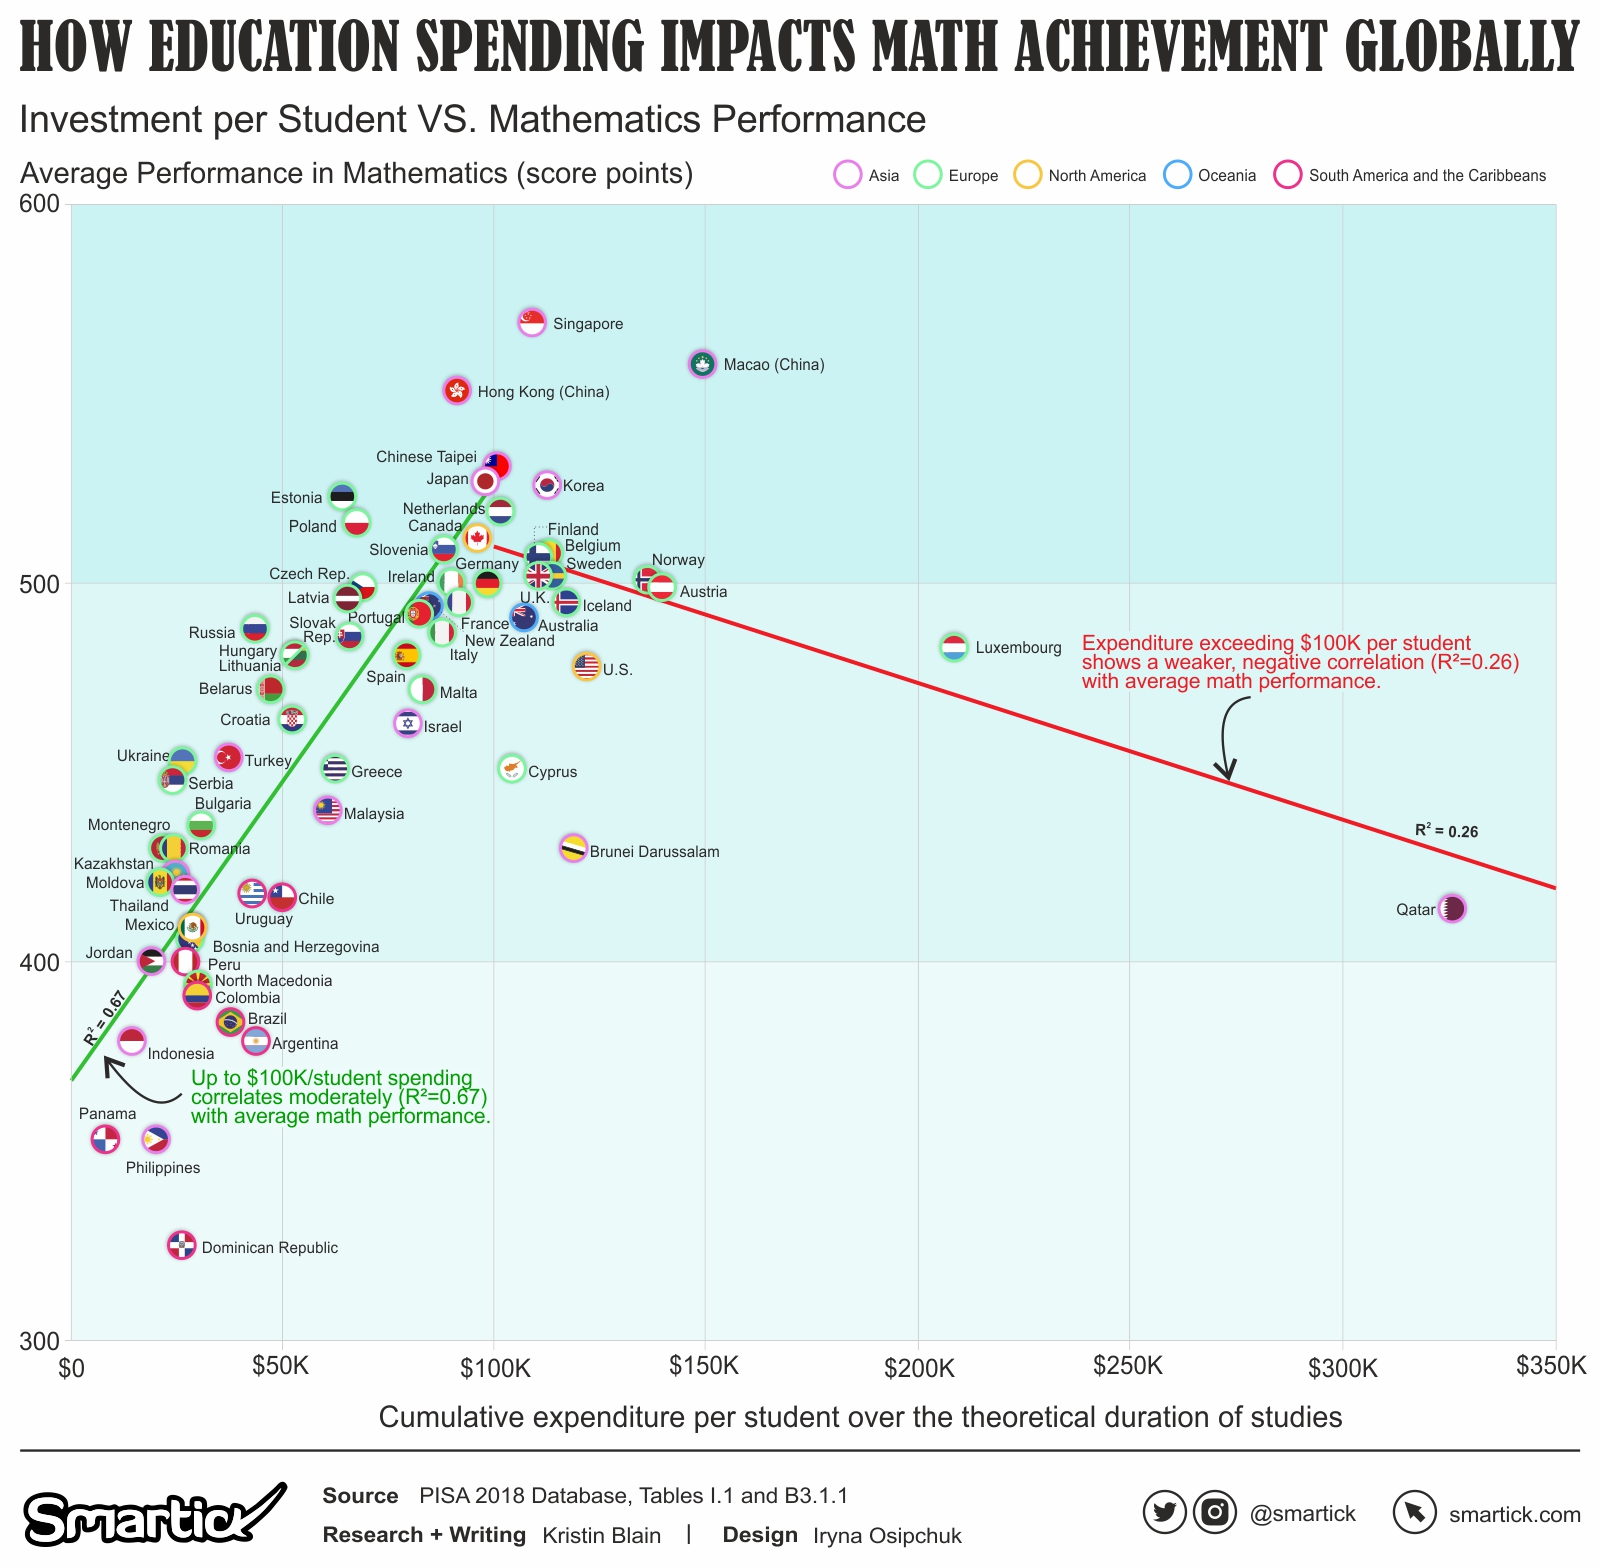
As we analyze the PISA 2018 data, a distinct pattern emerges. For educational spending up to $100,000 per student throughout the theoretical duration of their studies, a significant correlation is evident between investment and math achievement. Countries investing more tend to observe higher math scores, while those investing less tend to have lower scores.
This positive correlation, represented by an R² value of 0.67, indicates that an increase in education spending within this range is strongly associated with improved math scores. However, it’s essential to acknowledge that while this correlation is moderately robust, other contributing factors also significantly influence math achievement.
The Turning Point at $100,000?
However, the data presents a noteworthy shift when we examine spending levels exceeding $100,000 per student. Rather than a continued escalation in math scores, we observe a weaker correlation, reflected by an R² value of 0.26. Beyond this threshold, higher spending displays a less significant impact on math scores. In essence, the relationship between increased spending and improved math achievement weakens considerably.
Outliers that Challenge Conventions
The outliers in the dataset challenge the conventional wisdom. One such outlier is Macao (China), which invests a staggering $149,234 per student and boasts a remarkable mean math score of 558. However, even with this high spending, Macao (China) shows the almost negligible correlation trend, indicating that there’s more to the equation than just pouring in money.
Regional Highlights
Asia: Asian countries, such as Singapore, Chinese Taipei, and Korea, not only invest heavily in education but also achieve top-tier math scores, supporting the direct correlation theory. Yet, within Asia, we observe outliers like Qatar, which invests lavishly but lags behind in math scores. This points to the importance of not just how much is spent but also how effectively it is allocated.
Europe: European nations like Luxembourg and Austria demonstrate a direct correlation between spending and math scores. However, some countries like Finland and the Netherlands strike a balance between investment and outcomes, showing that smart spending can yield excellent results. The relatively high R-squared value of 0.211 for the $0 to $50,000 spending range in Europe suggests that, while the correlation is still not incredibly strong, it’s more apparent compared to other regions.
South America and the Caribbeans: Countries in this region, such as Chile and Brazil, exhibit the direct correlation, but they also face challenges in maximizing the impact of their spending. The R-squared value of 0.011 for spending above $50,000 emphasizes that beyond a certain point, simply throwing money at the problem does not yield better results.
North America: The United States and Canada invest considerably in education, and while they enjoy above-average math scores, they fall short of the highest performers. This highlights the complexity of the education equation, where economic factors, curriculum, and teaching methods also play pivotal roles. The R-squared value of 0.011 beyond $50,000 in North America reflects the diminishing returns of higher spending.
The PISA 2018 data clearly illustrates that education spending is a critical factor in shaping math achievement, up to a certain threshold. Within this spending range (<$100,000), there is a positive correlation, suggesting that increased investment can lead to improved math scores, although the relationship is relatively weak. However, beyond this threshold (>$100,000), the correlation becomes almost negligible, indicating that additional spending does not significantly impact math achievement.
This data reveals a more nuanced reality in which efficient use of resources, effective teaching methods, and socio-economic factors are equally vital in the quest for academic excellence. Striking the right balance between investment and quality is the true key to unlocking the full potential of education systems worldwide. As we navigate the complex relationship between spending and outcomes, the R-squared values provide insight into the strength of this connection, emphasizing the need for a holistic approach to education reform that goes beyond financial investments.